
2. PEU and BMU Benchmarks
PEU and BMU Benchmarks offer a large breadth of indices allowing any portfolio or group of assets to be benchmarked easily.
Coverage spans over 100 countries and geographic regions, 12 activity classes, 3 lifecycle phases, 4 revenue models, 2 customer models, and 3 value chain types.
Combinations are a function of universe coverage of a minimum number of eligible assets.
Maintenance is carried out based on eligibility and data availability.
This product suite provides multiple index series that combine the performance of a large number of private companies globally to reflect the overall, segment-wise, and regional performance of the private asset class in a precise, granular, and frequent manner while avoiding the usual biases of estimated, appraised, or self-reported data commonly part of other private market benchmarks.
Different from the flagship market indices, i.e., the private2000, the Private Equity-backed Universe or PEU and the Broad private Market Universe or BMU Benchmarks offer more permutations and combinations of indices. While the flagship indices provide a succinct and representative summary of the performance of aggregate private markets, the PEU and BMU Benchmarks provide more customised and granular combinations of assets that are relevant to benchmarking any specific portfolio or funds. In other words, these indices allow one to select a segment or group of companies that can be directly relevant to one’s portfolio.
Specifically, the PEU (and BMU) Benchmarks are the result of several hundreds of combinations of the PECCS™ classification, geographic regions, and styles of private companies, built from the expanded coverage of all the private companies in the PEU (BMU). The PEU consists of companies whose size distribution, profit profiles, and sectoral representation match those of private market transactions, while BMU Universe includes all eligible private companies (PEU & BMU determination description).
The key difference between PEU and BMU relies on the universe of companies used. BMU is ideal for understanding the performance of aggregate and key segments in private markets, while PEU allows focusing on the usual companies that interest PE investors, as their size and profit profiles are more in sync with PE-style investments.
On this page, we provide details on how we arrive at the list of eligible companies that can be included in the index and the actual determination of the PEU and BMU Benchmarks.
Note that the number of constituents, entrants, and exits in these indices are not strictly monitored like in the flagship Market Indices.
Key specifications of the PEU and BMU Benchmarks
When is a PEU or BMU Benchmark created?
If the combination of filtering criteria including regions, countries, and PECCS™ classes and subclasses in the PEU results in over 10 companies in any month and has a rolling average in a one-year window of over 25 companies, then a PEU and a corresponding BMU Benchmark are created.
How is a PEU and BMU Benchmark maintained?
Maintenance of these indices includes exclusion of companies whose financials become stale, lose eligibility to be classified under the segment of the index (for example, startup companies can evolve into mature at some time), and dropping bankrupt companies and those that are publicly listed. These are done on an ongoing basis, and the index is recomputed with the remaining constituents and any that newly qualify for the segments. There are no annual reconstitutions for these Benchmarks, and no region, country or PECCS™ segment receives any pre-defined weights for index inclusion.
Other kinds of benchmarks
Benchmarks are not just constrained to combinations of two or more segments but can also include combinations of PEU, BMU, and market indices with different weights according to the needs and exposures of a user’s portfolio to provide a more bespoke reference point.
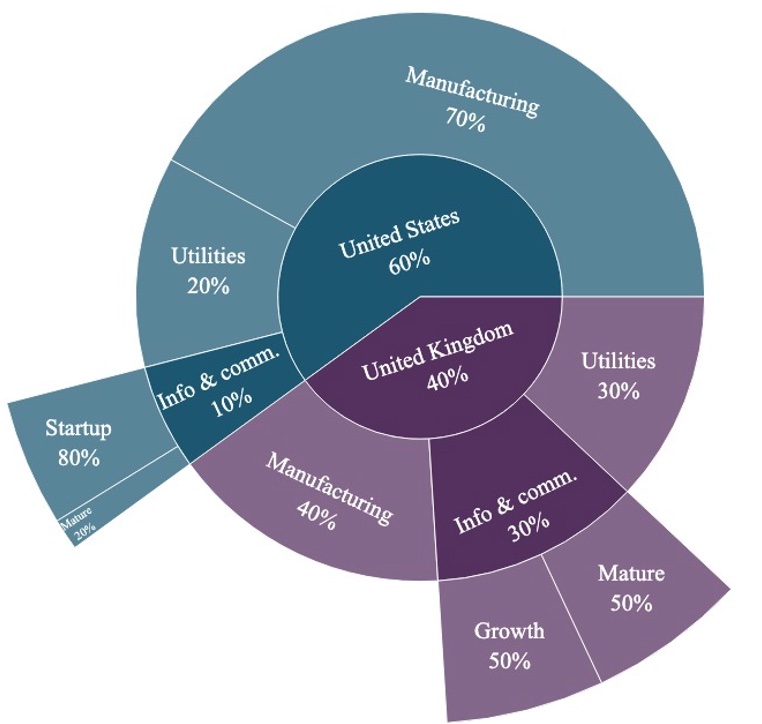
For illustration, consider an investor who is invested in the United States and the United Kingdom, with exposure to three industrial activities. Further, in the Information & Communication activity, the investor has selected investments based on the lifecycle phase in each of the two countries. This investor can combine the below indices and benchmarks as per the weights of their portfolio to produce a unique custom benchmark. The relevant indices/benchmarks and their weights in the custom benchmark for this investor are presented in the table.
Table: Relevant indices and benchmarks and their weights in the custom benchmark | |||
PEU Benchmark | Client can receive | Client’s Portfolio | Included Indices/Benchmarks |
Self-computed Custom PECCS™ Strategy Benchmark | Historical valuation and analytics benchmark for the combination of assets shown in figure above. | Effective PECCS™ and geography weights | PEU US Utilities: 12.0% PEU US Manufacturing: 42.0% PEU US Info. & Comm. Startup: 4.8% PEU US Info. & Comm. Mature: 1.2% PEU UK Utilities: 12.0% PEU UK Manufacturing: 16.0% PEU UK Info. & Comm. Growth: 6.0% PEU UK Info. & Comm. Mature: 6.0% |
A mix-and-match custom PEU Benchmark
All of the privateMetrics® market indices and PEU/BMU benchmarks come with a wealth of analytics, allowing users to understand the index or benchmark's drivers of risk and performance, extreme risk, concentration, key risk factors, etc.