
1.4.1 BMU & PEU determination
Determining the universe of private companies is a combination of assessing private companies' likelihood of being regarded as investable and their eligibility to be investable. For estimating the likelihood, we focus on the characteristics of private companies that resemble those that private equity funds have invested in the past. To determine the eligibility, we lay down the rules that make the companies investable. These criteria, when combined with the index methodology, lead to three distinct buckets of private companies, as shown below:
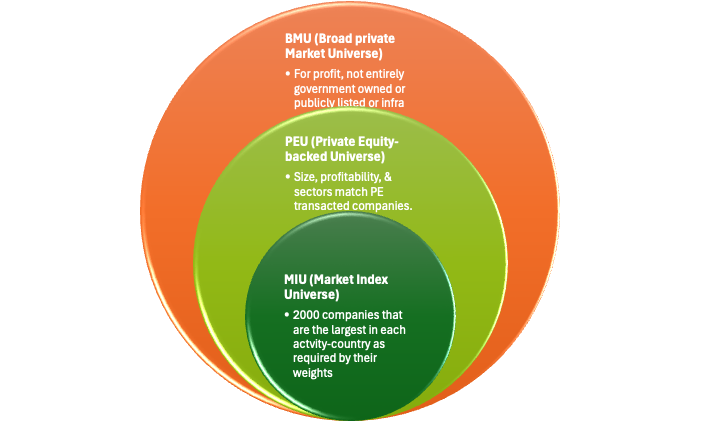
Three privateMetrics® universes of private companies
Broad private Market Universe or BMU
The constitution of the broad private market universe relies on simple rules that make a private company eligible for investment. These rules include:
The company should not be dissolved, liquidated, or declared bankrupt at the time of consideration.
Is a for-profit private company with a capital structure that does not have any security (equity or bond) traded publicly at the time of consideration.
If it is a subsidiary of another private company, only the parent company is eligible for inclusion, provided its financial information is available.
Is not entirely government-owned or controlled.
Has non-negative sales, with the average sales in the past being over USD 1 million, and preferably has two fiscal years of financial accounting data that is accessible.
Has a business and industrial activity description.
Exclude companies that are specifically available to be included in the infrastructure indices of inframetrics.
Information on the key factors that are used to price the private company using our factor model approach is available. Missing information is imputed provided there is sufficient information in the sector, year, and country available and the factor being imputed is not one of the primary factors affecting its valuation.
Private companies that pass these filters are considered to be part of the broad private market universe.
Private Equity-backed Universe or PEU
How do private equity managers select their targets? Not all companies can be suitable to be professionally managed. Some may lack professionalism. Some sectors may be too regulated and not support private equity strategies. Some businesses may not be scalable, and some may lack the profit margins that allow private equity-owned transformations. Thus, we attempt to focus more on companies that can accommodate PE ownership strategies rather than focus on all the private companies in the privateMetrics® database.