
3.2 Top-down Macro Approach
A potential source of dividend data is the national tax collection authority as dividends are usually doubly taxed, once at the hands of the dividend payor as corporate profits, and again at the hands of the dividend receiver as income. Thus, tax authorities need to be aware of dividends paid, even if the entity is privately owned.
Pursuing this avenue, in the US, the Bureau of Economic Analysis or the BEA is the formal statistical agency for the US, working under the Department of Commerce. They publish a list of macroeconomic data including national income, GDP, and other series that are followed with great interest to get a sense of the US economic conditions.
BEA’s data sources include multiple government agencies, including the tax authorities. Since dividends are taxed at the investor level as well, they are likely declared by corporations in their tax filings (Internal Revenue Service, 2023). According to BEA (Fixler et al., 2006), a brief description of their data sources is reproduced below:
"Data collected by Federal Government agencies provide the backbone of the estimates; these data are supplemented by data from trade associations, businesses, international organisations, and other sources. The Government data are from several agencies, mainly the Commerce Department's Bureau of the Census, the Labor Department's Bureau of Labor Statistics, the Internal Revenue Service and other agencies of the Treasury Department, the Office of Management and Budget, and the Agriculture Department. Some of the Government-collected data, referred to as ‘administrative’ data, are byproducts of government functions such as education programs, tax collection, defence, and regulation."
Exploring BEA data, there is an aggregate dividend data series that is published at a quarterly frequency, which can be made use of. However, since this is aggregate economy-wide information, adjustments need to be made for sectors and also for the component of dividends that are paid by publicly listed companies. Each of these adjustments is described below, which produces a time series of dividend payments for each sector of private companies.
Disaggregating time series data by sectors
Disaggregating the economy-wide dividend series into sectoral-level dividends involves two key challenges. The first step is to map the sectoral scheme used by the BEA with that of what we use in-house, namely the PECCS™ activity classification. The second is to identify the weights of each sector in the economy to break down the dividends. The way we tackle both these challenges is described below.
BEA does provide certain data such as the gross domestic product breakdown at the sectoral level. The sectors it uses to break down aggregate data are shown in the second column of the Table below, along with its mappings with PECCS™ activities. Note that most sectors are mapped directly as one/many BEA sectors to one PECCS™ activity. However, four PECCS™ activities, including health, professional & other services, education & public, and real estate & construction, are not directly similar to any other BEA sectors. To bridge this gap, we take the remaining unmapped BEA sectors, which include “Other Nonfinancials” and “Other Nondurables”, and distribute them equally among the four remaining PECCS™ activities.
Table: Mapping PECCS™ Activities to BEA Sectors | ||
PECCS™ Activity | BEA Sector | Weight of assignment to PECCS |
Financials | Financials | 100% |
Transportation | Transportation & Warehousing | 100% |
Utilities | Utilities | 100% |
Natural resources | Petrol & Coal | 100% |
Hospitality & Entertainment | Food, Beverages, & Tobacco | 100% |
Retail | 1. Wholesale | 100% |
Information & communication | 1. Information | 100% |
Manufacturing | 1. Fabricated Metal Products | 100% |
Health | Remaining unmapped sectors, including Other Nonfinancials and Other Nondurables | 25% |
Professional & other services | Remaining unmapped sectors, including Other Nonfinancials and Other Nondurables | 25% |
Education & public | Remaining unmapped sectors, including Other Nonfinancials and Other Nondurables | 25% |
Real estate & construction | Remaining unmapped sectors, including Other Nonfinancials and Other Nondurables | 25% |
The total profits and dividends produced by the BEA are presented in the figure below.
Aggregate Dividends and Profits Using BEA Data
Next, to break down the aggregate dividend series provided by BEA into sectoral data, we need appropriate weights. Static weights would do a disservice as sectors evolve. The selection of weights should preferably satisfy the below conditions:
the weights should be dynamic in time.
the weights should be consistent with the above proposed PECCS™ mappings, and
the weights should be consistent with the dividends-generating process (mechanisms)
An obvious choice that satisfies the above criteria is to divvy up the sectoral corporate profits provided by BEA according to the above mapping in the table and use the proportion of profits as weights to split the aggregate dividends. However, when certain sectors in the BEA data have negative corporate profits in aggregate in certain quarters, we can ignore such weights and interpolate values between positive reported values.
However, this can lead to another less pleasant scenario where in some sectors where public companies pay higher dividends (e.g., Utilities), the latter step of removing public dividends depresses the private dividends and hence the payout ratios of firms in that activity. Thus, to avoid this problem, we recompute the weights based on the dividends paid by the public companies each month in each of these activities. Thus, the aggregate dividend series is split into activities based on the weights of companies in the same public activity to total dividends paid by public companies. Likewise, the aggregate profits (sum of all activity profits) are also split in the same ratio as that of public companies.
Removing public dividends from the BEA disaggregated series
To arrive at a sector-level private dividend series, the step remaining is to remove the effect of dividends paid by publicly listed companies from the disaggregated dividend series. Doing so requires a reliable source of publicly listed companies around the world and their dividend payouts and a classification scheme that is compatible with what is proposed in the table above as a way of mapping the BEA sectors to PECCS™ activities.
To keep things simple, we focus only on the U.S., where public company data is reliably available, and use data from Compustat, which covers all publicly listed companies trading in the different exchanges in the U.S. markets. Both common and preferred dividend payout data are available for these public companies. To reduce complexity, we assume the dividends are paid at fiscal year ends for each of the companies, and then we transform the dividend data to panel data. Specifically, we create month-year-sector data where each row corresponds to a month-year and a sector. For each row, we compute the rolling 12-month sum of dividends paid that includes dividends of all companies in the sector with a fiscal year-end that falls within the previous 12 months. To arrive at quarterly payouts, the dividend sums are then divided by 4.
Then we make use of a mapping between the GICS (Global Industrial Classification Code) and the PECCS™ activity codes. The mapping considers the earlier mapping we did between BEA sectors and PECCS™ activities. Specifically, the four activities that could not be mapped, including health, professional and other services, education & public, and real estate & construction, are mapped in an aggregated manner with all the relevant GICS for the four activities based on weights that are equally split between the four. Moreover, in the mapping, when one GICS class is related to multiple PECCS™ activities, they are linked in an equally weighted manner across these multiple activities. For example, GICS code 254010, which corresponds to the Media sector, is equally weighted between Hospitality and Entertainment (50%) and Information & Communication (50%) activities.
The dividends to common shareholders of public companies are aggregated as per the sectoral mappings in the table. The monthly series of such dividends of publicly listed companies aggregated across PECCS™ activities is shown in the figure below, along with the payout ratios in the next figure. Notably, dividends have been increasing over time, with Manufacturing and Financials companies accounting for the lion share of the payouts. Payout ratios are erratic and range between 20% and 100% for most of the periods, with some outliers.
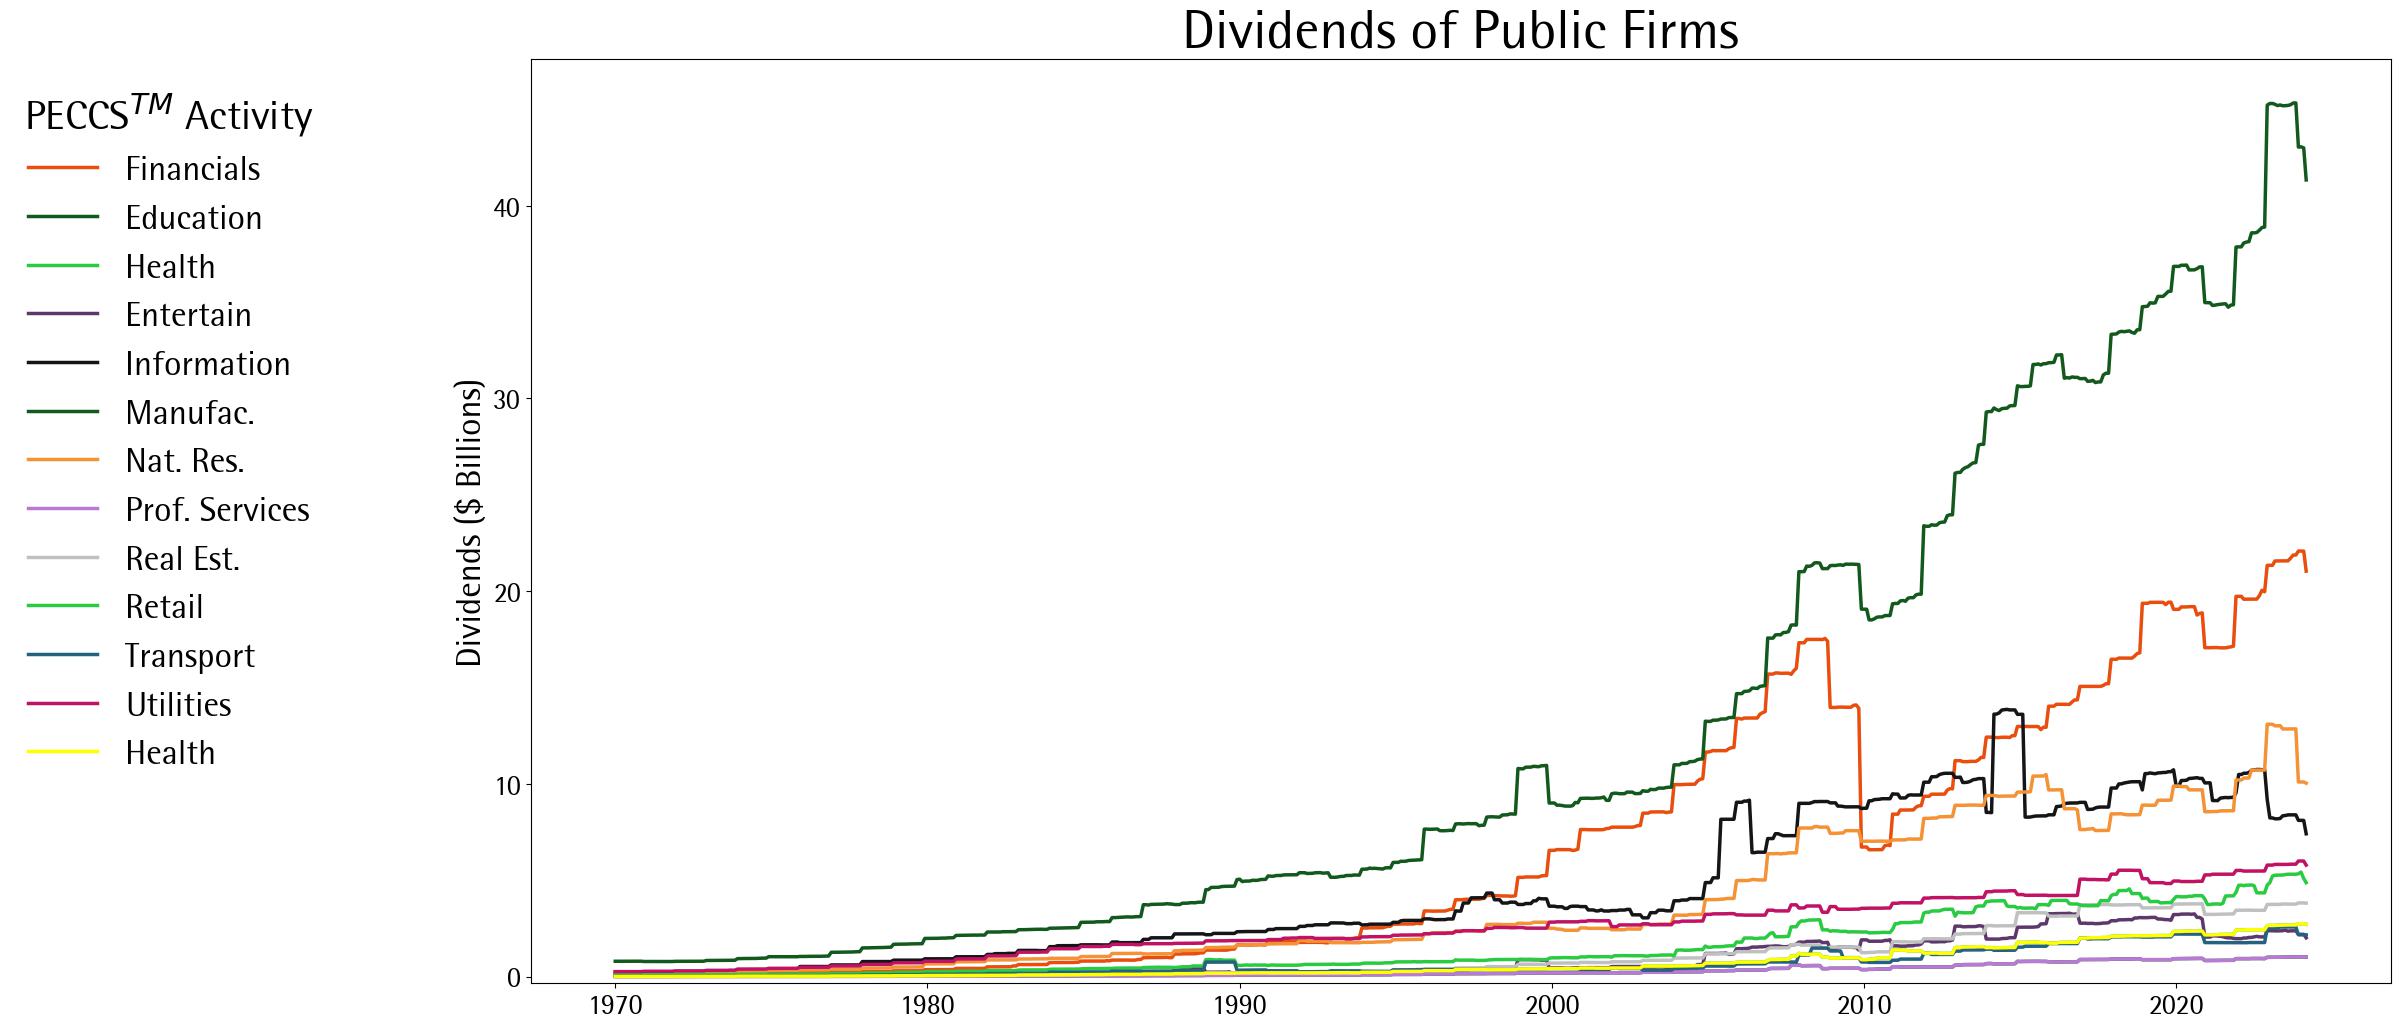
Dividends of Publicly Listed Companies According to PECCS Activities
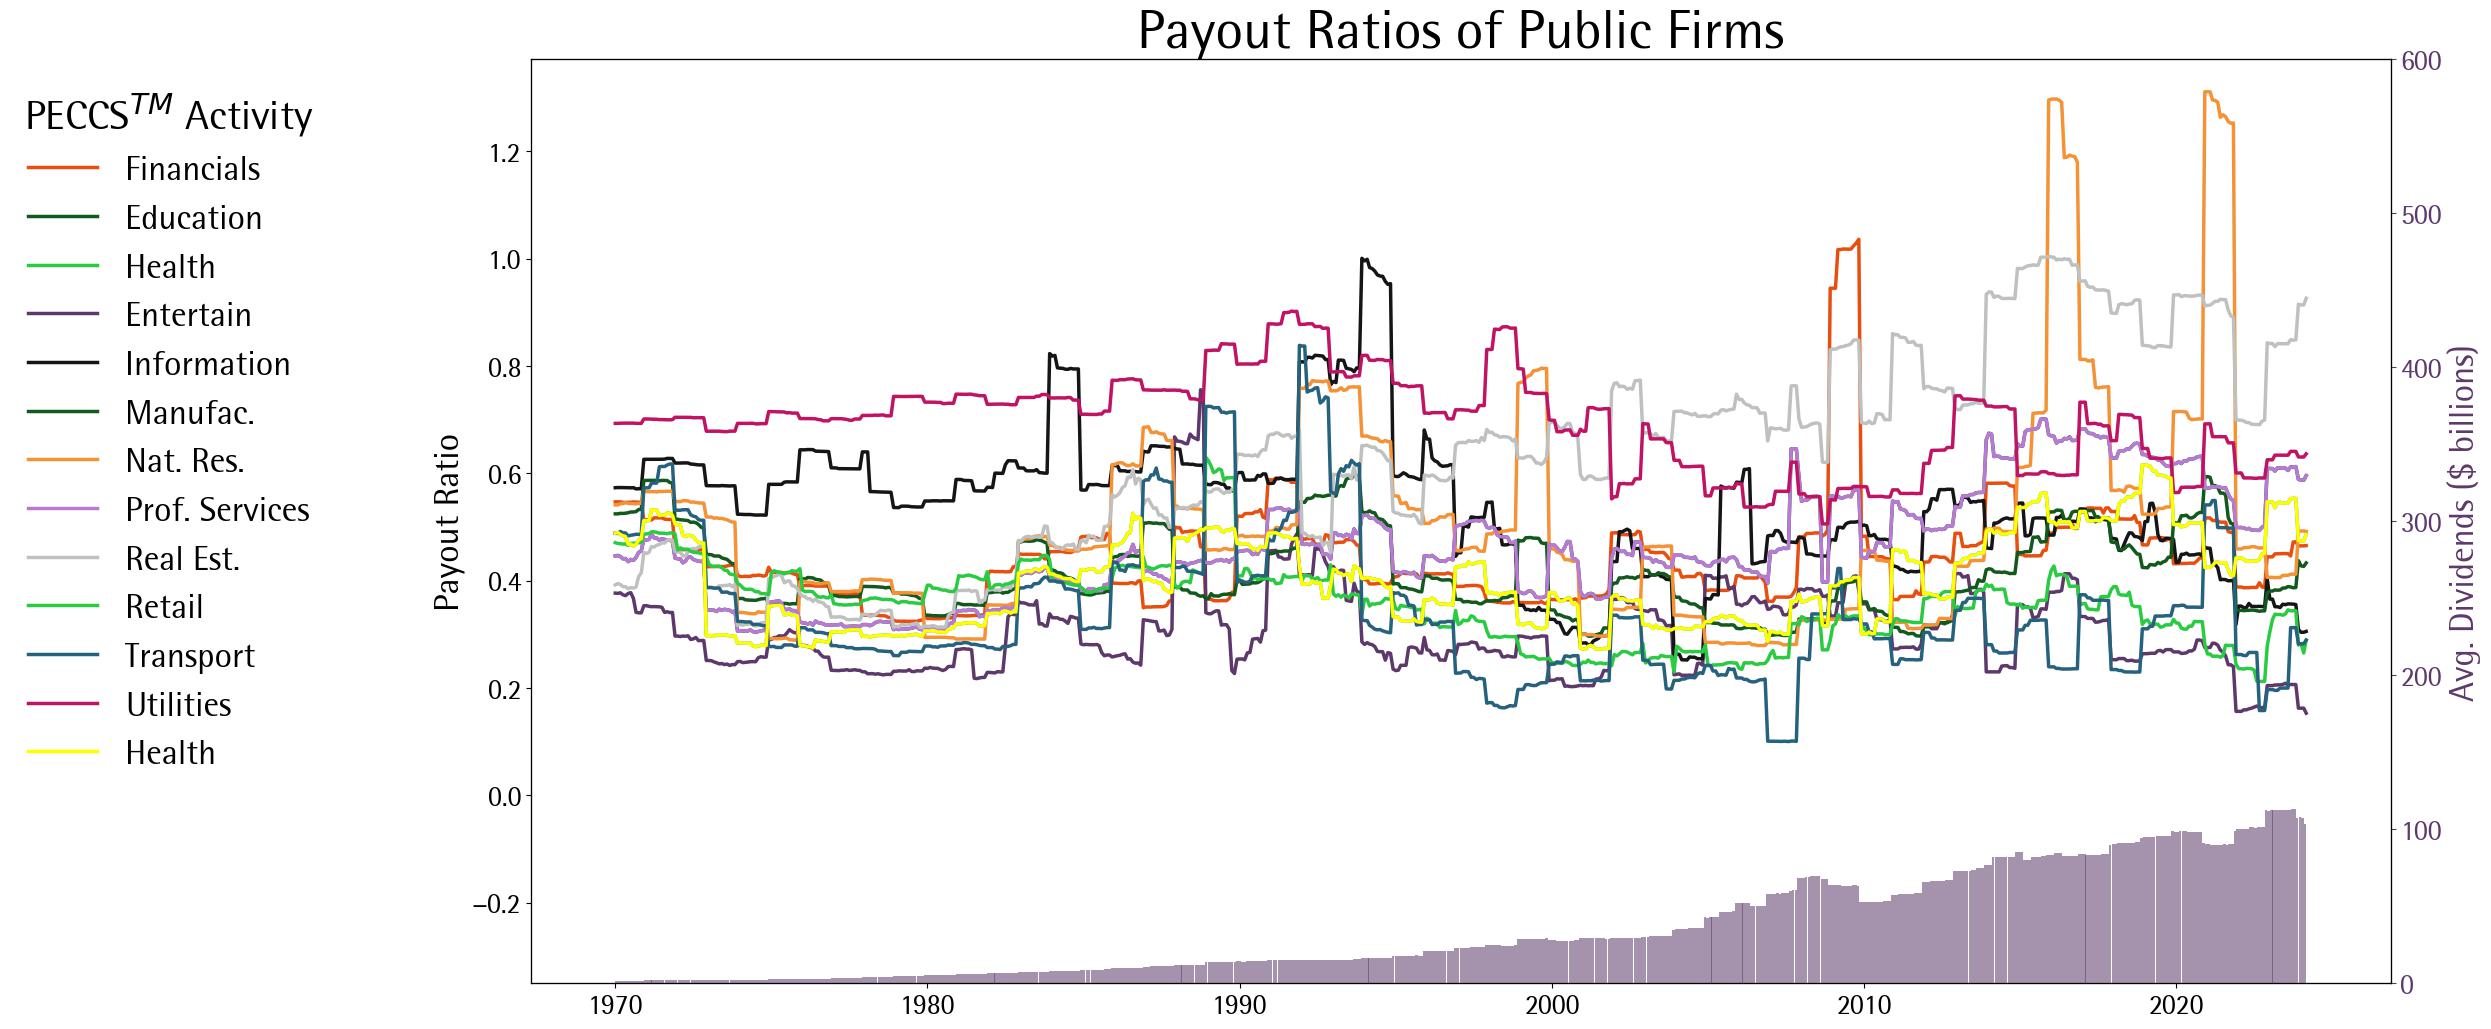
Payout Ratios of Publicly Listed Companies According to PECCS Activities
Having obtained the dividends of publicly listed companies at a required level of granularity and desired frequency, we merge this data with the sectoral BEA data. Then we compute the private companies’ dividends as the sectoral dividend series from the BEA minus the public companies’ dividends, based on which we also compute the payout ratios. The exact steps in these computations are:
Subtract the public companies’ dividends at the PECCS™ activity level from the BEA dividends at the PECCS™ activity level.
Replace negative values that arise in Step 1 with zero.
Convert the dividends computed as a rolling window sum of 4 quarters to nullify seasonality.
In a similar manner, convert the aggregate quarterly corporate profits from BEA (where again negative values are converted to zero) into a rolling window sum of 4 quarters to nullify seasonality. Note that public companies' profits are too volatile (owing to several discretionary items in their statements), and hence not subtracted from the BEA corporate profits.
Compute the payout ratios as the ratio of the series in Step 3 with that of the series in Step 4.
At places where the dividends in Step 3 are zero (if at all), interpolate the payout ratios from nonzero values in the past and future.
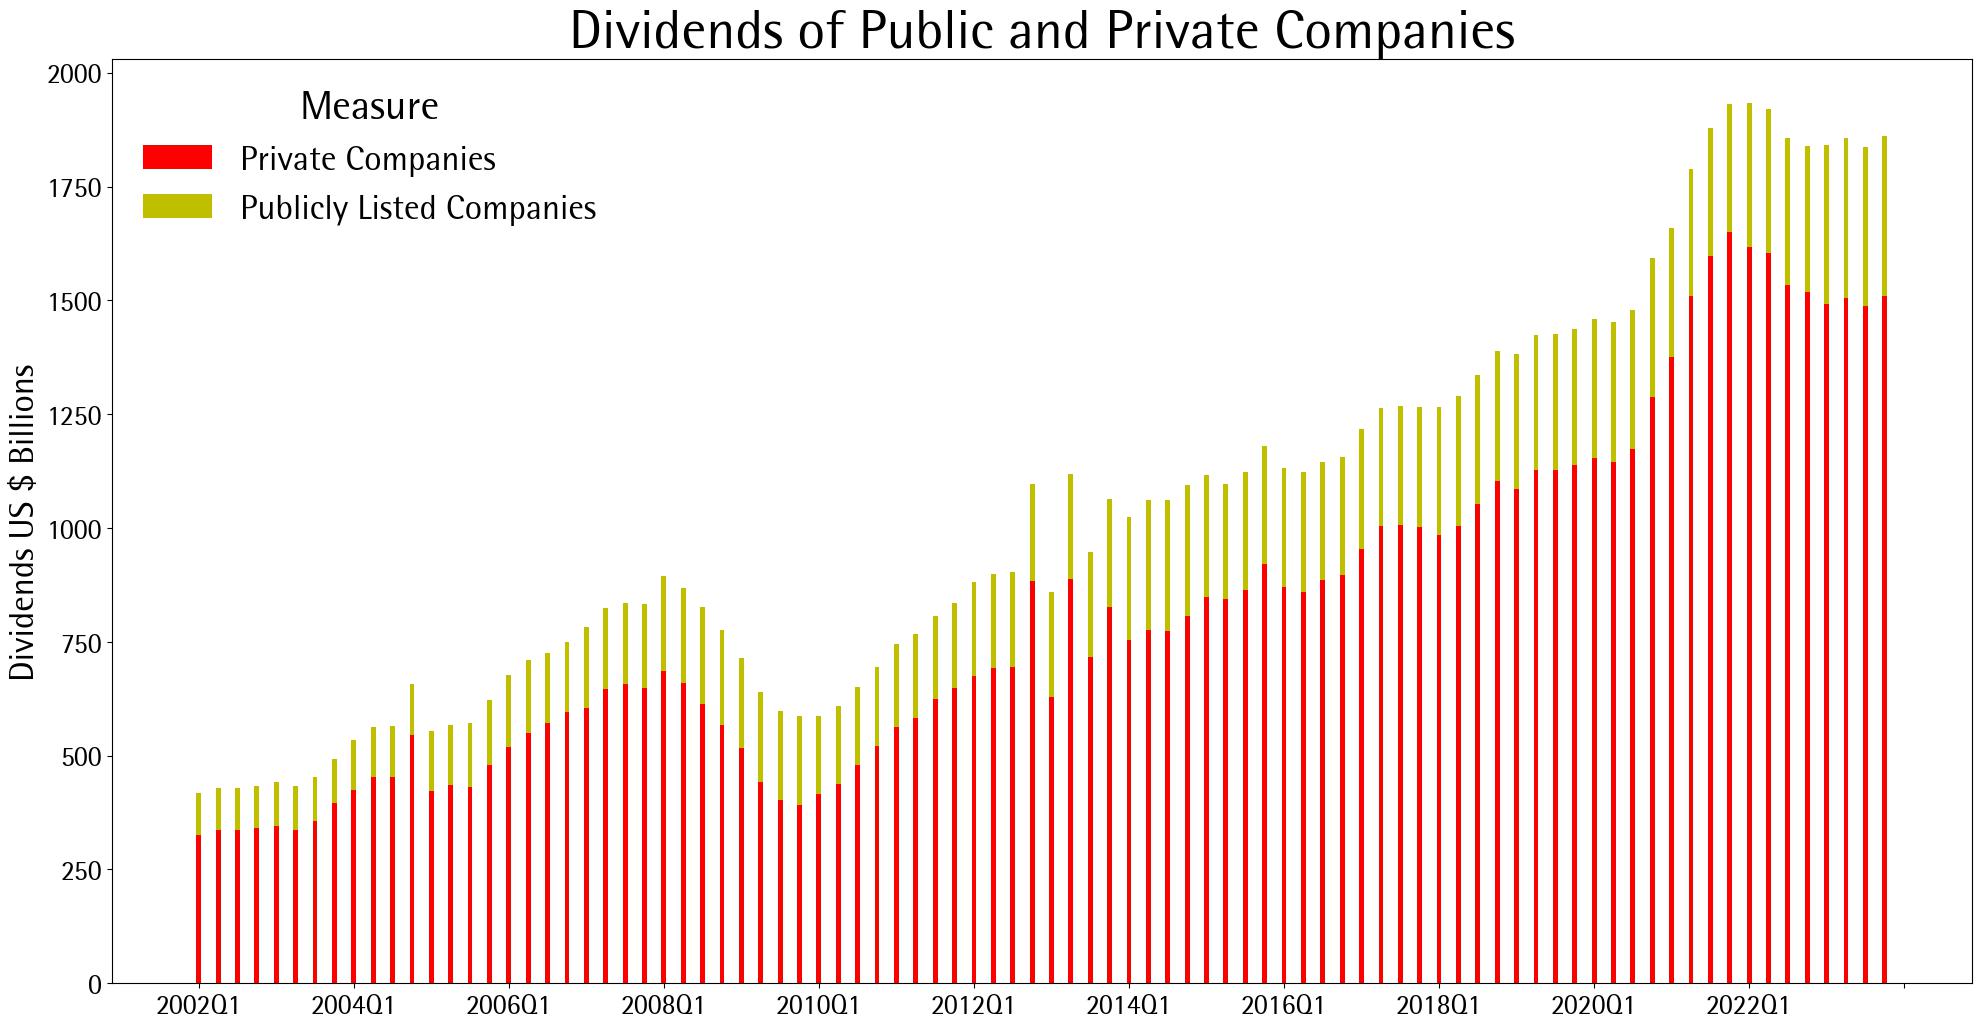
The values thus produced are tabulated in the following figures. The first figure shows the split of dividends among public and private companies produced by the steps described above. It shows that private companies form a larger proportion of aggregate dividends in the economy, which is consistent with the preference of public companies to engage in share buybacks in the US.
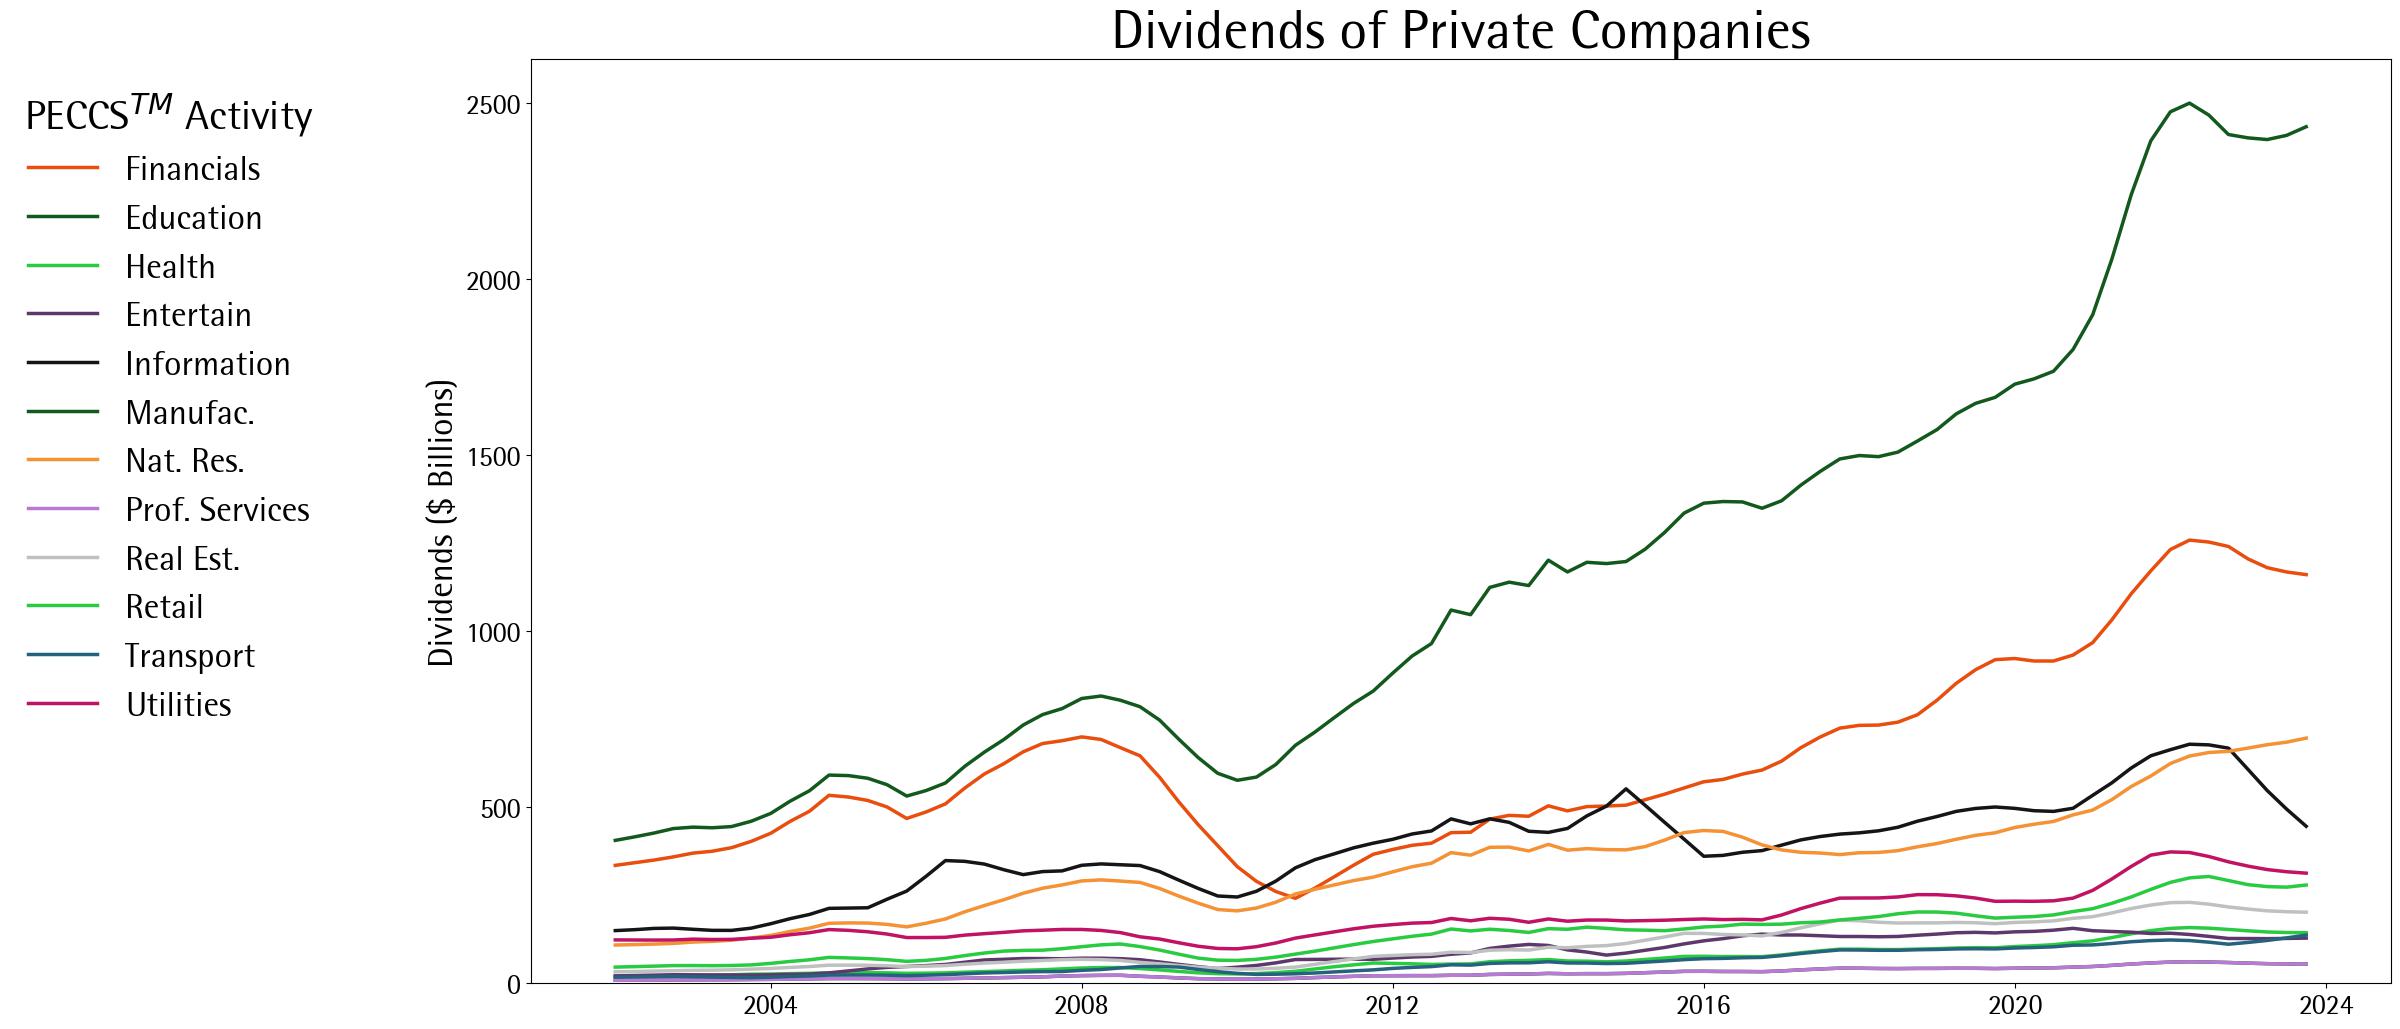
Dividends of Private Companies According to PECCS Activities
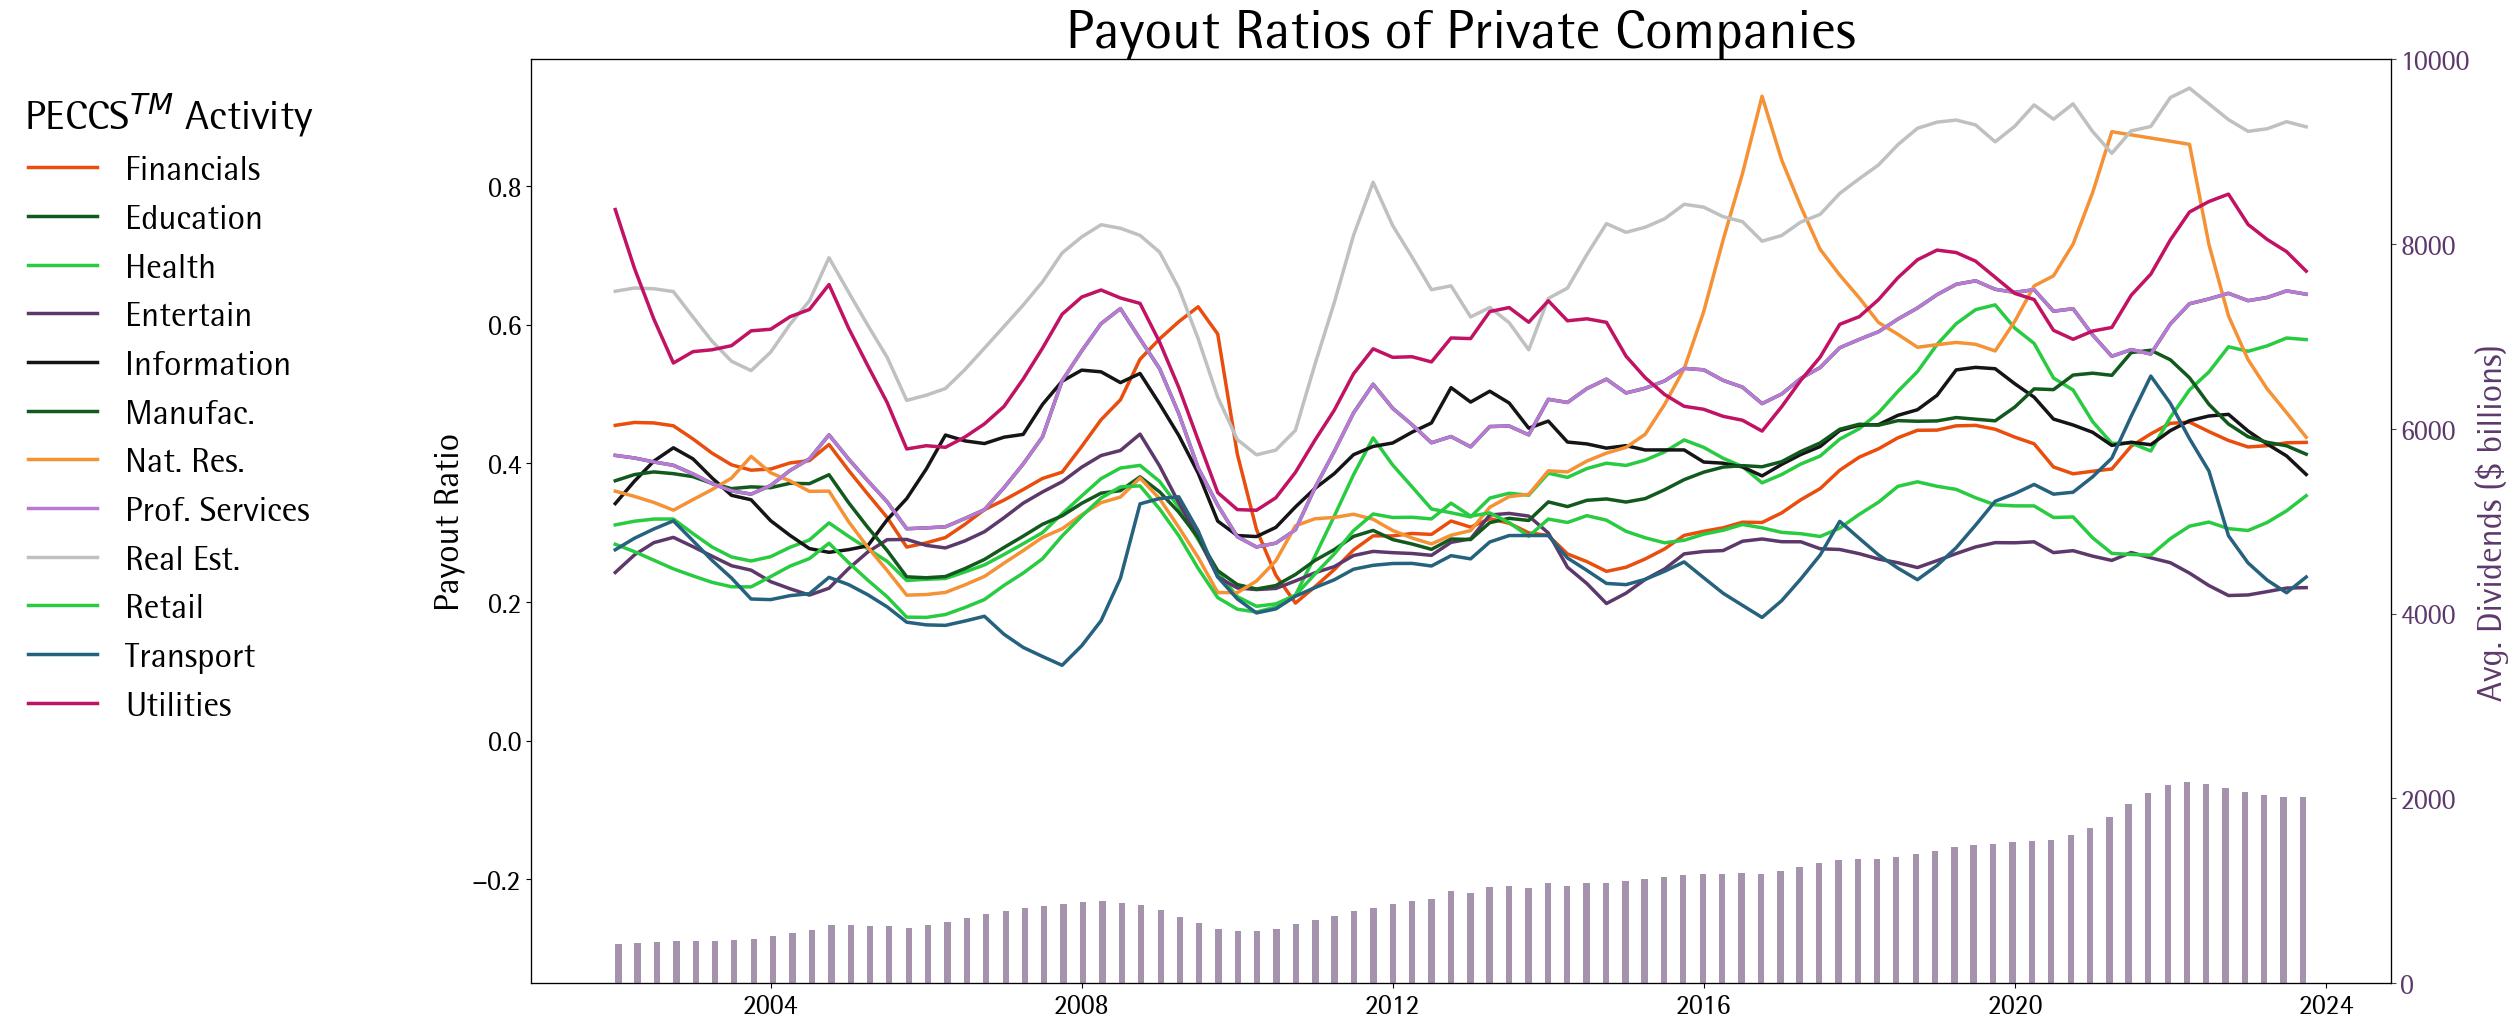
Payout Ratios of Private Companies According to PECCS Activities
In the above two figures, we plot the dividends and payout ratios of private companies according to PECCS™ activities. The trends are similar to public companies in that the dividends are increasing over time. In addition to Financials and Manufacturing, which pay higher dividends among publicly listed companies, the Real estate, health, and Information private companies also pay sizable amounts of dividends. In terms of payout ratios, the aggregate payouts range between 0 and 0.6 for most of the sectors and periods. The financial sector, however, has breakout periods of high dividend payouts.
These PECCS™ activity level payout ratios provide an attractive candidate as dividend inputs to compute total return indices for privateMetrics® indices. These payout ratios can be superimposed on company level profits to estimate the dividends, which can then be aggregated at the level of indices and superimposed on price returns to produce total returns.
Comparing the modelled payout ratios with alternatives
To validate the generated payout ratios, in this section, we perform two validation/comparisons with other sources of data, which independently are incomplete to produce sectoral series, but can produce comparative aggregate payout ratios. Specifically, first, we borrow the dividends that are carefully collected and quality-checked for the infrastructure universe by us, i.e., Scientific Infra & Private Assets. Second, we exploit the dividend information available in a vendor’s database with non-missing information and construct an aggregate payout series using it. Using both sources, we find that the payout ratios are quite comparable with the infra universe, especially the utilities sector in PECCS™ closely tracks the infrastructure universe. Moreover, for the vendor with non-missing dividend information for a small sample, our modelled dividends are correlated at a level of 0.57.
Internal Revenue Service. (2023). Forming a Corporation. IRS. https://www.irs.gov/businesses/small-businesses-self-employed/forming-a-corporation
Fixler, D., Reinsdorf, M., & Smith, G. (2006). Measuring the Economy: A Primer on GDP and the National Income and Product Accounts. Bureau of Economic Analysis. https://www.bea.gov/system/files/papers/P2006-8.pdf