
How does the Comps Builder Tool work?
Answer
The Comps Builder tool examines all data points available from a specified valuation window (at minimum a 2-year window and at maximum a 10-year window).
The Comps Builder tool first looks at the mean and medians metrics for selections made within “Deal Profile”, where you have the choice of class selections for Geographies and TICCS® pillars such as Industrial Activities, Business Risk, and Corporate Structures. The Comps Builder tool then applies the Law of Averages to all the mean and medians of each selection made under Deal Profile to then present a benchmark for the chosen metric within the specified valuation window.
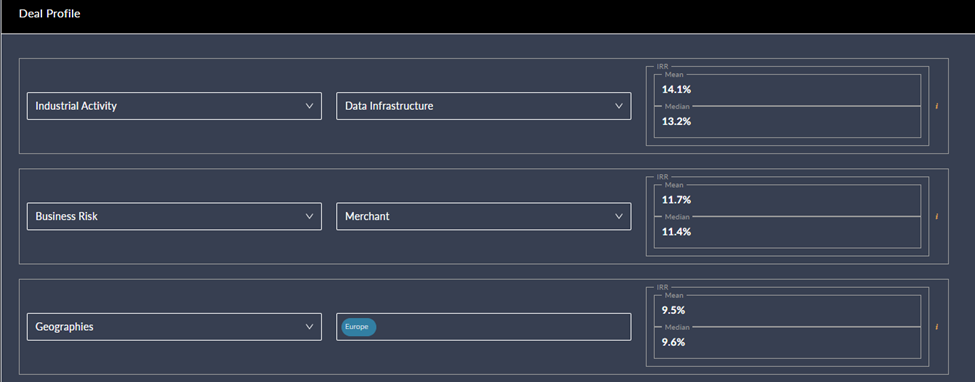
An example of examining “IRR” as the chosen metric, Merchant Data Infrastructure companies in Europe specified as the Business Risk, Industrial Activity, and Geography, respectively.
The “Deal Characteristics” selection then allows you to go a step further in customising your comparables set for a chosen metric. Here you can specify specific asset characteristics as a factor value or select a quintile. The Deal Characteristics takes into account all previous selections made in the Deal Profile to produce overall mean and medians as well as the ranges for your chosen metric based on a more granular sample.
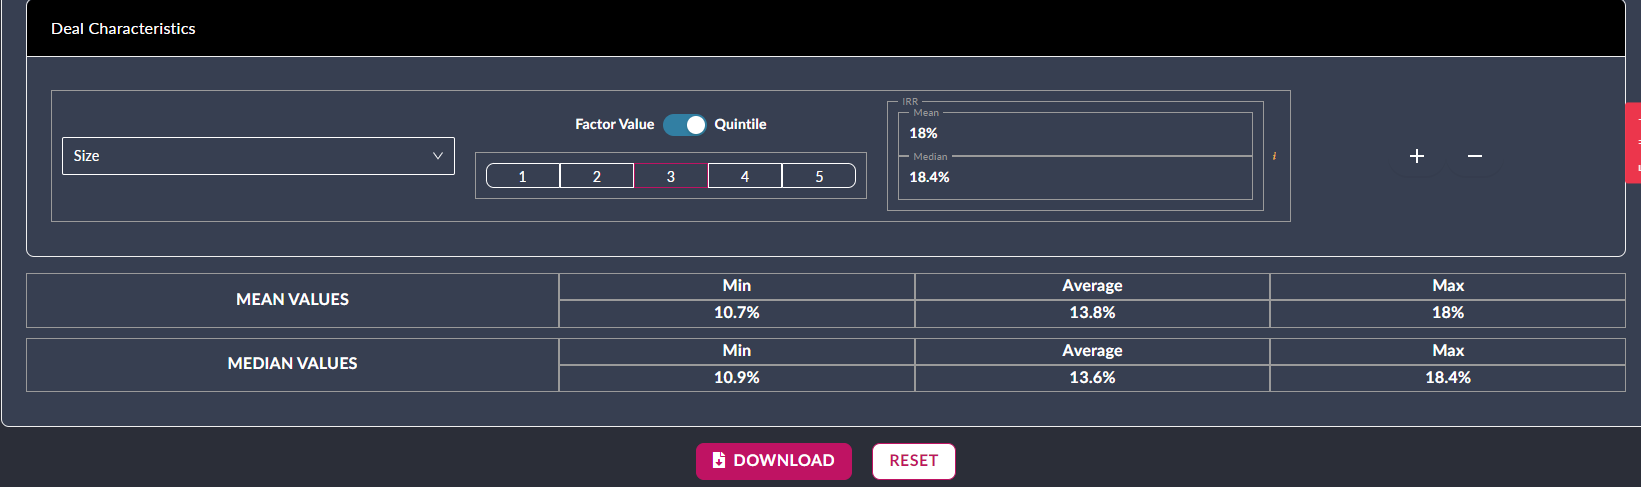
The average and range of IRRs for the aforementioned selections (Merchant Data Infrastructure in Europe), when selecting the 3rd quintile of Size (defined as Total Assets).
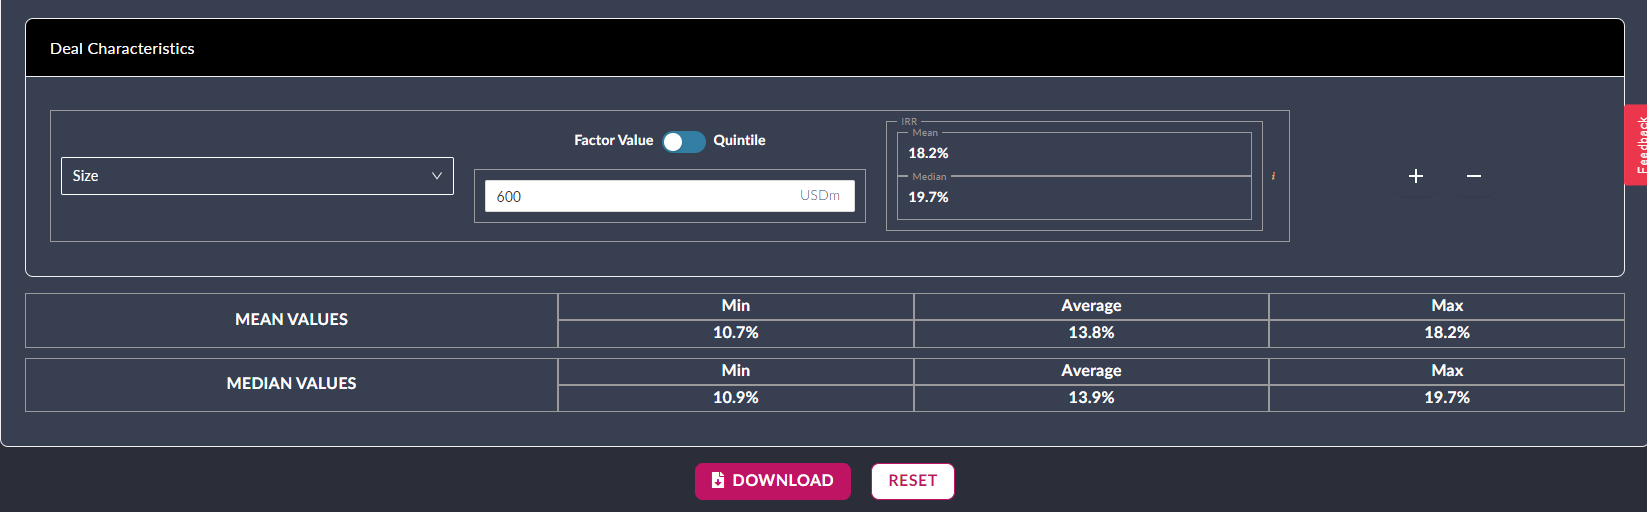
The average and range of IRRs for the aforementioned selections (Merchant Data Infrastructure in Europe), when specifying a size of 600m USD.
Further Reading
To understand our approach behind the Comps Builder Tool, you can watch our webinar from 2023: Why it matters to have good data to use comparables.