
b) extreme transition and physical risk metrics
The alignment metrics above do not distinguish between the impacts of transition and physical risks because they are designed to address the overall effect of aligning with the Paris Agreement. However, to further differentiate and understand the risks solely from carbon taxes or physical damages, we run simulations with and without carbon taxes or physical damages within a given scenario and provide two additional metrics[1]:
Extreme[2] Transition Risk metric:
This metric calculates the relative difference in NAV within the disorderly transition scenarios between simulations where carbon emissions are included and excluded. This metric measures the potential losses purely due to carbon emissions in the disorderly transition scenarios.Extreme Physical Risk metric:
This metric calculates the relative difference in NAV within the no transition scenarios between simulations where physical damages are included and excluded. This metric measures the potential losses purely due to physical risks in the no transition scenarios.
The figure below shows the Extreme Transition Risk (in blue) and Extreme Physical Risk (in red) metrics averaged for all companies in the infra300 index based on NGFS’ and Oxford Economics’ scenarios. Again, the values represent the wins and losses of NAV in percentage compared to simulations with no carbon emissions and physical damage.

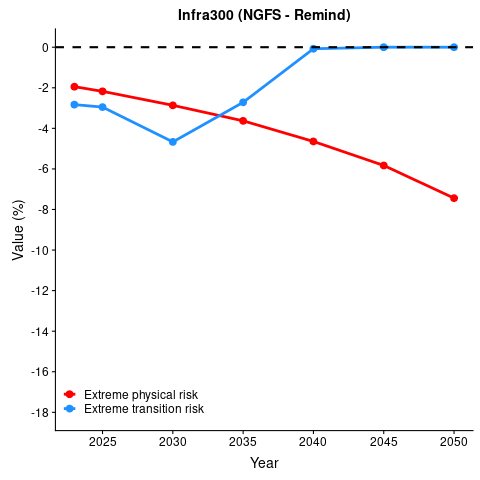
Estimations of the Extreme Transition Risk and Extreme Physical Risk metrics until 2050 based on Oxford Economics' (left) and NGFS’ (right) scenarios.
Assets’ NAV losses face the highest Extreme Transition Risk in 2025 (Oxford Economics) and 2030 (NGFS), respectively. After, the risk steadily returns back to zero (no difference in NAV value) because of the decrease in carbon emissions by 2050.
In conclusion, our climate risk analysis shows that infrastructure companies would fare the best if they follow an orderly transition path, which starts the energy transition immediately. By delaying the transition, companies could expose themselves to significant losses from carbon costs. However, transitioning late is still preferable to not transitioning, which would come with extreme losses from physical risks.
[1] Note that calculating the difference in NAV within the same scenario cancels the macroeconomic effects. Therefore, the metrics measure the potential losses purely due to a company’s specific exposure to transition and physical risks.
[2] The metrics are labelled as “extreme” because the simulations are applied to those scenarios with the highest transition and physical risk, respectively.