
2.4.3 Climate risk model
To develop climate scenario models and climate risk metrics, we focus on three scenarios from both NGFS and Oxford Economics:
Orderly transition scenarios that project a world aligning with the Paris Agreement immediately to mitigate climate change without abrupt transition shocks:
NGFS: We select the Net Zero 2050 scenario because the projections in the Below 2°C scenario act partly contradictory to the scenario’s narrative.
Oxford Economics: We select the Net Zero scenario as the most comparable one to the orderly NGFS scenario.
Disorderly transition scenarios that project a world aligning with the Paris Agreement in 2030 and, hence, applying heavy tax shocks in order to mitigate climate change:
NGFS: We select the Delayed Transition scenario as the only disorderly scenario.
Oxford Economics: We select the Delayed Transition scenario as the most comparable one to the disorderly NGFS scenario.
No transition scenarios that project a world without actions to mitigate climate change:
NGFS: We select the Current Policies scenario because the projections in the NDC scenario partially contradict the scenario’s narrative.
Oxford Economics: We select the Climate Catastrophe scenario as it represents the respective worst-case scenario (comparable to Current Policies). It needs to be noted that the selected no transition scenarios do not share the same assumptions.
The goal of our climate risk model is to quantify climate risks for infrastructure assets at different future horizons. For this, we need to estimate assets’ values in different climate scenarios and compare them across scenarios using Scientific Infra & Private Assets' asset valuation approach. The regressions that feed the climate risk model describe the relationship between infrastructure financials and macroeconomic variables. Finally, we explain how transition (specifically, carbon taxes) and physical risks can be integrated into the projected financials to estimate assets’ values in any given climate scenario. The figure below illustrates the functioning of the climate risk model and the dependencies between key variables.
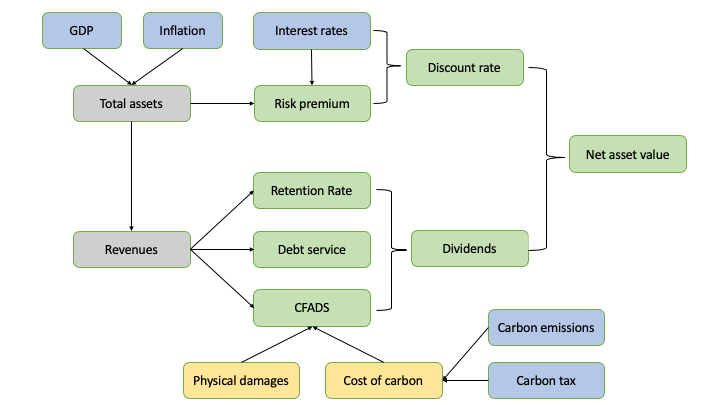
Schematic illustration of the climate risk model.
Note: blue: macroeconomic variables taken from NGFS and Oxford Economics; yellow: asset-level climate risk variables (carbon costs and physical damages); grey: financial input variables of Scientific Infra & Private Assets' asset pricing model; green: calculated output variables