
a) late alignment and no alignment risk metrics
In regards to climate risks, one of the most relevant information for infrastructure investors and shareholders is the difference in lost or saved asset value between an immediate alignment with the Paris Agreement (i.e., following the orderly transition path), a delayed alignment (i.e., following the disorderly transition path), and a world that does not align (i.e., following the no transition path). We developed two risk metrics that compare assets’ NAVs in different scenarios:
Late Alignment Risk metric:
This metric calculates the difference in NAV between the disorderly and the orderly transition scenarios. Accordingly, it measures the potential losses if the world aligns late (i.e., 2030) with the Paris Agreement.No Alignment Risk metric:
This metric calculates the difference in NAV between the no transition and the orderly transition scenarios. Accordingly, it measures the potential losses if the world does not align with the Paris Agreement.
The figure below shows the Late Alignment Risk (in blue) and the No Alignment Risk (in red) metrics averaged for all companies in the infra300 index based on NGFS’ and Oxford Economics’ scenarios. The values represent the wins and losses of NAV in percentage compared to the orderly transition scenario.
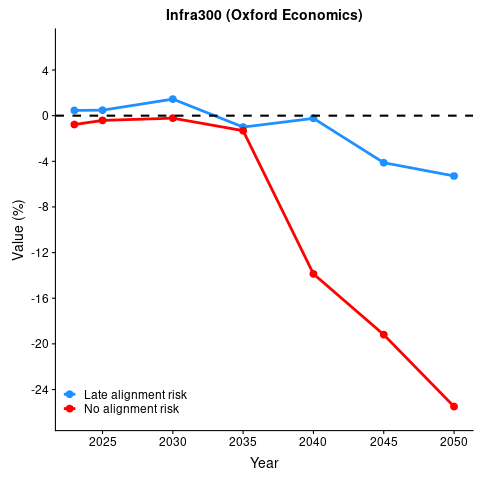
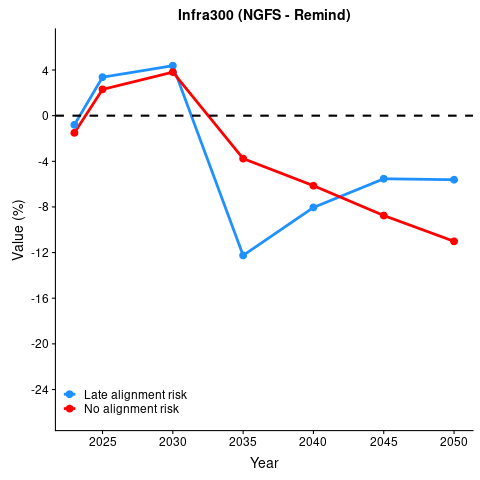
Estimations of the Late Alignment Risk and the No Alignment Risk metrics until 2050 based on Oxford Economics' (left) and NGFS’ (right) scenarios.
For both scenario providers – Oxford Economics and NGFS – the Late Alignment Risk metric starts with an increase in NAV (compared to the orderly transition scenario), followed by losses after 2030 when a carbon tax is introduced. This means avoiding paying carbon taxes until 2030 would initially benefit companies for a short period but cost more in the long run. The NGFS scenarios imply higher risks than Oxford Economics because of a higher carbon tax in the disorderly transition scenario.
If the world does not align with the Paris Agreement, infrastructure companies will initially face little impact and – under the NGFS scenarios – assets’ NAV could even benefit until 2030. However, after 2030 and 2035 (based on NGFS’ and Oxford Economics’ scenarios, respectively), losses in assets’ NAV soar significantly as hazard events become more frequent and severe, causing increased physical damages. Based on Oxford Economics’ no transition scenario, infrastructure companies’ NAV would be about 25 per cent less in 2050 compared to the average NAV in the orderly transition scenario. Even in NGFS’ more optimistic scenarios, the average loss in 2050 approaches 12 per cent for companies in the infra300 index.