
1.3 Our Asset Pricing Approach
Public market performance provides poor proxies for private markets
Transaction prices in private markets vary systematically according to the characteristics of the company and market
Our factors have an economic rationale to affect valuation, are statistically related to valuation, and are observable/measurable.
Key factors in our model include size, profits, maturity, leverage, and country risk.
Our models also control for market valuation, PECCS™ classes, and transaction characteristics.
Our models are estimated dynamically, allowing factor prices (or effects) to continuously evolve as more transactions are observed.
Public Markets Cannot be the Benchmark for Private Assets
The formation of prices in private markets differs considerably from listed equities. Private companies are inextricably linked to the economy as they must face market demand, obtain financing, withstand business cycle fluctuations, and access capital markets for investor exits, thus exposing them to similar factors as publicly listed firms. So a casual view can indicate public markets as being appropriate benchmarks for private companies.
However, that view would be incorrect for several reasons, including but not limited to:
Disappearing public firms: In several countries, notably the U.S., the number of public listings and share issuances are shrinking (e.g., Doidge et al., 2018). These patterns arise from a combination of factors such as higher compliance costs and short-term investor bases in public markets, and also an increasing supply of private capital. These trends make public markets an unsuitable and poor benchmark for private markets.
Leverage: Leverage in private markets is often higher on average, as the predominant strategy of PE funds has been leveraged buyouts, leading to distinct risk profiles of private companies vis-à-vis publicly listed companies (e.g., Chingono and Rasmussen, 2015).
Diversification: The costs of diversifying a portfolio of stocks to investors are relatively lower than executing a diversified strategy among private companies, due to lumpy and large investment requirements, the poor information environment, higher due diligence requirements, and increased operational involvement. Thus, public benchmarks that are diversified may make poor proxies for concentrated portfolios of private companies.
Systematic Patterns in Private Market Valuation
Public markets cannot be used entirely as proxies for measuring and tracking private market performance. However, a specific combination of private market (systematic) factors and asset-specific (idiosyncratic) information explains private asset prices. Valuations in private markets are not set in isolation or separate silos from other parts of the economy. For example, the price that a buyer is willing to pay for a private company depends on:
How large or small is the company?
Future revenue potential of the company
How levered is the company currently?
What are the profit margins of the company?
At first glance, these may all look like idiosyncratic characteristics of the company, however, that view cannot be far from the truth. For example, if we were to observe a large sample of transactions, it would become apparent quickly how investors systematically arrive at valuation with respect to its size, i.e., investors may pay a premium (or a discount) when buying a smaller company, ceteris paribus. Similarly, the effect of future revenue potential and leverage on valuation correlates with future overall economic growth and interest rate policies, respectively, thus having a systematic effect on valuation across private companies. Moreover, profit margins may systematically vary across industries and time, thus illustrating a common (or systematic) valuation component.
To illustrate this point further, we perform the following exercise. We collect a large dataset of Private equity-backed transactions (N = 6,088) in private markets. Then for a few key company characteristics including its size, growth, profitability, maturity (measured as the age of the company), leverage, and country risk (measured as term spreads), we split the sample into quartiles (i.e., four ranked groups) of each of these measures, and compute the average valuation in each quartile. We present the results in the table below. We can see that the systematic effects exist in the average valuation as we move from the first to fourth quartiles, across many of these measures.
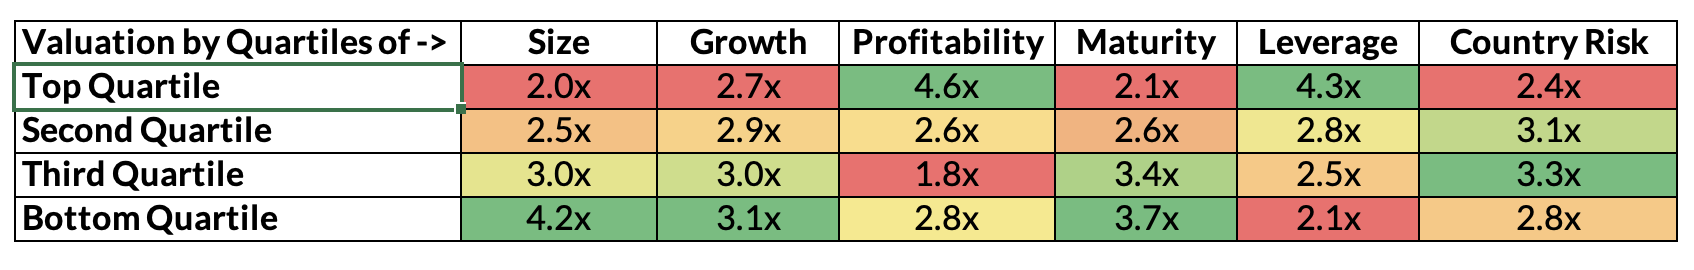
Recorded Transaction Price Multiples of Private Companies by Quartiles of Key Factors
Considering size as the metric, the largest companies on average, receive a lower valuation whereas smaller companies receive a higher valuation. Similarly, such monotonic patterns (i.e., increasing or decreasing as we move down the quartiles) exist across most of the key factors in the table.
These provide a good motivation to apply a factor model to learn about the systematic factors in private company valuation.
Principles Behind Factor Choices
Having established that systematic patterns exist in the valuation of private companies as observed in transaction prices, we proceed to construct a factor model that can explain the variance in observed transaction prices. Developing our factor model we pursue the objective of having a satisfactory explanation of observed variance in transaction prices and also having a parsimonious model at the same time. Keeping the model parsimonious will help have greater accuracy out of the sample
The factors affecting the valuation are determined by quantitative analysis and we use it to predict the systematic part of private asset prices. In other words, our model will be able to explain what is the average expected value of a private company given its characteristics. Estimating the systematic part of valuation is useful as it provides a robust prediction of the average price, once idiosyncratic aspects are diversified away in an index i.e., a portfolio.
An important aspect of estimating the factor model is to propose what the factors are. Our factor selection rests on three criteria by order of importance:
Economic rationale implying a systematic link with transaction prices, e.g., larger size implies high illiquidity and a lower price, ceteris paribus.
Statistical evidence of covariance between factor loadings (betas) and reported transaction prices
Availability of data for predictors to the model can be used to shadow price all the assets in the universe.
With these principles, we use three distinct sources of information to construct our factors, including the below:
Published academic work in finance that documents a relationship between the measure and returns/valuation. We do not restrict our attention to studies that focus on private companies alone, as there is limited work in this area, constrained by both the lack of detailed datasets for private company characteristics or regular/frequent valuation data, and broadened our research to consider factors that satisfactorily explain returns in public markets as well.
We conducted a survey of over 100 General Partners in 2023, asking them questions about their valuation approaches such as the factors they consider, the relative importance of the factor set, and their use of industry classification schemes.
Finally, we consider certain institutional characteristics that are unique to private markets, such as the volume of transactions, the dry powder, etc.
Key Factors in Our Model
From the above approach, we evaluate several potential factors, which leads us to narrow down to key factors presented in the following table. The specifics of our econometric approaches are published as a paper available here.
For providing a summary, the table below lists our key factors, how we measure them, the observed effect on valuation, their meaning, and academic work that supports the hypothesised effect.
Table: Key Factors Employed in our Factor Model | ||||
|---|---|---|---|---|
Factor | Definition (Proxy) | Effect on price | Economic Rationale | References |
Size | Revenues | Negative | Larger firms are more illiquid and trade a lower price | Fama & French (1993) |
Growth | Change in Revenues | Positive | Companies with higher revenue growth trade at a higher price | Fama & French (1992), Petkova & Zhang (2005) |
Leverage | Total debt / Revenues | Positive | Companies that can borrow more have a lower cost of capital and a higher value | Gomes & Schmid (2010), George & Hwang (2010) |
Profits | Ebitda Margin | Positive | Companies that have higher profits have a higher value | Novy-Marx (2013), Hou et al. (2015) |
Maturity | Years since incorporation | Negative | Companies that are mature exhibit less growth potential and trade a at a lower price | Jiang et al. (2005) |
Country Risk | Term Spread | Negative | Companies in high-risk countries face more uncertain prospects | Chen & Tsang (2013) |
The extent to which our key factors affect the price-to-sales (or P/S) ratio in the transaction sample during 2013-2023 is provided in the table below in the form of univariate correlations between each predictor and the transacted P/S ratio, and we find that all of these variables have a statistically significant and strong relationship with valuation. Significance at the level of 1% and 5% are indicated with *** and **, respectively, in the table.
Table: Price-to-Revenue Multiple Correlation with Key Risk Factor Exposure, 2013-2023 | ||||
Risk Factor | Correlation Coefficient | Lower Bound Confidence Interval | Upper Bound Confidence Interval | Statistical Significance |
Size | -0.25 | -0.29 | -0.22 | *** |
Growth | +0.03 | 0.01 | 0.06 | ** |
Profitability | +0.21 | +0.17 | +0.24 | *** |
Maturity | -0.19 | -0.23 | -0.16 | *** |
Leverage | +0.31 | +0.28 | +0.34 | *** |
Country Risk | -0.06 | -0.01 | -0.03 | *** |
Control Variables in Our Model
Although the key factors explained above have significant effects on valuation and help keep the model parsimonious, only relying on them stymies the model from being able to accommodate the richness in price evolution in private markets. Thus, we follow an approach guided by the latest econometric techniques, to identify control variables that are observable during the transaction (deal characteristics) and market characteristics at the point of time of the transaction, which help in providing additional explanatory power to the model.
These additional control variables are shown in the table below along with their observed effect on valuation, the economic rationale behind the effect, and studies that motivate their inclusion.
Table: Other Control Variables in our Model | ||||
Factor | Definition (proxy) | Effect on price | Economic Rationale | References |
PE Deal Controls | Deal Leverage | Positive | Companies that transact with a higher deal leverage are considered to have better prospects and a higher value | Jenskinson & Stucke (2011) |
Percentage Control | Negative | A higher control stake in an acquisition creates larger risks and decreases the price. | Renneboog and Simons (2005) | |
Add-on | Negative | Add-on deals create new risks for investors including synergy risk. | Hammer et al. (2022) | |
PECCS™ Controls | Dummy variable for PECCS™ Activity and other segments | Positive or Negative | Different segments of private markets exhibit different average levels of price because of systematic differences in risk. | |
Equity Market Controls | Listed Industry Valuations | Positive | Higher same-sector valuations in listed markets correlate with higher same-sector private market valuations. | Chan et al. (2007) |
Residual Market Valuations | Positive | Higher listed market sentiment correlates with higher private market valuations | Bibo & Tian (2022) | |
Fama French Value Factor Return | Positive or Negative | The returns of the value factor correlate with private market valuations: private company investments are also a Value play. | Fama & French (1992) | |
Notably, we also include PECCS™ classes as control variables in the model. Although the PECCS™ taxonomy is constructed to group companies with similar risk factors, their inclusion as control variables should be based on whether they systematically capture valuation patterns. We test the validity in the table below, where we summarise the average valuation, measured as price-to-sales and price-to-Ebitda in our transaction sample.
Table: Average Valuation by PECCS™ Classes, 2013-2023 | ||
Activity | P/Sales | P/EBITDA |
Education and public | 1.9x | 12.4x |
Financials | 2.4x*** | 11.1x** |
Health | 2.1x | 13.1x*** |
Hospitality and entertainment | 1.9x | 11.5x** |
Information and communication | 2.6x*** | 12.8x*** |
Manufacturing | 1.5x*** | 10.1x |
Natural resources | 1.9x | 7.4x** |
Professional and other services | 1.6x** | 10.6x |
Real estate and construction | 1.8x | 10.5x |
Retail | 0.9x*** | 10.3x |
Transportation | 1.4x*** | 8.8x** |
Utilities | 1.9x | 10.2x |
All Transactions | 1.7x | 10.9x |
Lifecycle Phase | P/Sales | P/EBITDA |
Startup | 2.4x*** | 12.1x |
Growth | 2.1x | 12x*** |
Mature | 1.6x*** | 10.5x*** |
Value Chain | P/Sales | P/EBITDA |
Hybrid | 2.4x | 10.9x |
Products | 1.5x*** | 10.5x*** |
Services | 1.9x | 11.3x*** |
Revenue Model | P/Sales | P/EBITDA |
Advertising | 2.1x*** | 10.9x |
Reselling | 1.4x*** | 10x |
Production | 1.6x*** | 10.5x |
Subscription | 2.9x*** | 13.6x*** |
Customer Model | P/S | P/EBITDA |
Business Focused | 1.8 | 10.6*** |
Consumer Focused | 1.7x*** | 11.4*** |
How Does Our Model Evolve?
After having sorted the transaction dataset and the factors in the model, a pending question is how will the model cope with new data. Out of the sample, the model might perform poorly. How can one keep updating the model as new transactions are observed? In other words, if the model fails to update to new data, then its predictions remain anachronistic and irrelevant for the period of estimation.
We use a Bayesian approach to estimating the model as a dynamic linear model which assumes linear relationships between factors and valuation that naturally evolve over time, i.e., the model coefficients are estimated as a function of time, where at any point in time, all the data available till that date is made use of in the estimation. The technical details of the approach are provided in the paper (download full paper). Such an estimation ensures our model estimates valuation like how investors make pricing decisions in the markets, by making use of all the information available then.
The results of our model are summarised in the next section.
Doidge, C., Kahle, K. M., Karolyi, G. A., & Stulz, R. M. (2018). Eclipse of the Public Corporation or Eclipse of the Public Markets?. Journal of Applied Corporate Finance, 30(1), 8-16. Accessed July 17, 2024. https://doi.org/10.1111/jacf.12272.
Chingono, B., & Rasmussen, D. (2015). Leveraged small value equities. Available at SSRN 2639647. https://papers.ssrn.com/sol3/papers.cfm?abstract_id=2639647.
Fama, E. F., & French, K. R. (1993). Common risk factors in the returns on stocks and bonds. Journal of Financial Economics, 33(1), 3-56. Accessed July 17, 2024. https://doi.org/10.1016/0304-405X(93)90023-5.
Fama, E.F. & French, K.R. (1992). The Cross-Section of Expected Stock Returns. The Journal of Finance, 47(2), 427-465. Accessed July 17, 2024. https://doi.org/10.1111/j.1540-6261.1992.tb04398.x .
Petkova, R., & Zhang, L. (2005). Is value riskier than growth? Journal of Financial Economics, 78(1), 187-202. Accessed July 17, 2024. https://doi.org/10.1016/j.jfineco.2004.12.001.
Gomes, J.F., & Schmid, L. (2010). Levered Returns. The Journal of Finance, 65(2), 467-494. Accessed July 17, 2024. https://doi.org/10.1111/j.1540-6261.2009.01541.x .
George, T. J., & Hwang, C.-Y. (2010). A resolution of the distress risk and leverage puzzles in the cross section of stock returns. Journal of Financial Economics, 96(1), 56-79. Accessed July 17, 2024. https://doi.org/10.1016/j.jfineco.2009.11.003.
Novy-Marx, R. (2013). The other side of value: The gross profitability premium. Journal of Financial Economics, 108(1), 1-28. Accessed July 17, 2024. https://doi.org/10.1016/j.jfineco.2013.01.003.
Hou, K., Xue, C., & Zhang, L. (2015). Digesting Anomalies: An Investment Approach. The Review of Financial Studies, 28(3), 650-705. Accessed July 17, 2024. https://doi.org/10.1093/rfs/hhu068.
Jiang, G., Lee, C., & Zhang, Y. (2005). Information Uncertainty and Expected Returns. Review of Accounting Studies, 10(2-3), 185–221. Accessed July 17, 2024. https://doi.org/10.1007/s11142-005-1528-2.
Chen, Y.C., & Tsang, K.P. (2013). What does the yield curve tell us about exchange rate predictability? Review of Economics and Statistics, 95(1), 185-205. Accessed July 17, 2024. https://doi.org/10.1162/REST_a_00251.
Jenkinson, T., & Stucke, R. (2011). Who Benefits from the Leverage in LBOs? Available at SSRN: https://ssrn.com/abstract=1777266.
Hammer, B., Marcotty-Dehm, N., Schweizer, D., & Schwetzler, B. (2022). Pricing and value creation in private equity-backed buy-and-build strategies. Journal of Corporate Finance, 77, 102285. Accessed July 17, 2024. https://doi.org/10.1016/j.jcorpfin.2022.102285.
Renneboog, L. D. R., & Simons, T. (2005). Public-to-Private Transactions: LBOs, MBOs, MBIs and IBOs. (TILEC Discussion Paper; Vol. 2005-023). TILEC.
Chan, L. K. C., Lakonishok, J., & Swaminathan, B. (2007). Industry Classifications and Return Comovement. Financial Analysts Journal, 63(6), 56-70. Taylor & Francis, Ltd.
Liu, B., & Tian, X. (2022). Do venture capital investors learn from public markets? Management Science, 68(10), 7274-7297.