
1.4 Results of our Asset Pricing
Average model errors are very close to zero for all the transactions, and also in each PECCS™ class.
The model errors are normally distributed.
Estimated valuations closely mimic the transaction prices, not producing any model-induced artifacts.
Market control variables are not key to private market valuations - for example, a model without market factors does equally well.
Average Model Errors
We estimate the average errors for our model in the transaction sample, and find it to be very close to zero. The table below present the average error in each PECCS™ class, which are all found to be quite small, indicating that the model performs quite well in capturing average prices.
Table: Average Model Error by PECCS™ Classes | ||
PECCS™ Pillar | PECCS™ Peer-Group | Mean Estimation Error |
Full sample | 1.1% | |
PECCS™ Activity Segment | Education & public | 0.9% |
Financials | 1.8% | |
Health | 2.6% | |
Hospitality & entertainment | -1.1% | |
Information & communication | -4.4% | |
Manufacturing | 2.5% | |
Natural resources | 9.4% | |
Professional & other services | 3.3% | |
Real estate & construction | 1.9% | |
Retail | 0.5% | |
Transportation | 7.2% | |
Utilities | -2.2% | |
PECCS™ Pillar | PECCS™ Peer-Group | Mean Estimation Error |
Full sample | 1.1% | |
PECCS™ lifecycle | Mature | 2.8% |
Growth | -1.7% | |
Start-up | 0.1% | |
PECCS™ Revenue Model | Production | 2.9% |
Advertising | 1.2% | |
Subscription | -6.9% | |
Reselling | 4.6% | |
Cust. Model | Consumer focused | 0.9% |
Business focused | 1.5% | |
PECCS™ Value Chain | Products | 1.1% |
Services | 3.4% | |
Hybrid | 0.6% |
Model Residuals
If the factor model performs a decent job of capturing the average transaction prices, the errors or the difference between the predicted price and actual transaction price should be random and behave like “white noise”, i.e., have a mean of zero and a symmetrical bell-curve distribution.
The histogram of the factor model residuals is shown below, and it has all the properties we desire of a good model, i.e., the factors pick up the market signal and leave out the idiosyncratic noise of each transaction. Each residual in the figure represents a deal-specific effect and not a market signal, and on average has an equal chance of being positive or negative with a zero mean.
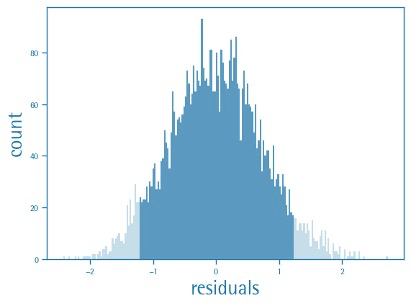
Histogram of Factor Model Errors
Time Series Trends
In the figure below, we show the time-series trends in private market transactions. Based on the coefficient estimates from our models, we compute the predicted valuations and a moving average series based on predictions, shown by the orange series. For comparison, the time-series ratios for the S&P 500 and Russell3000 indices, popular benchmarks for investors, are also shown in the figure. It also indicates the correlation coefficients between the private companies’ moving average series and the two benchmarks. The figure also shows the moving average of the raw valuations and the number of transactions happening each month in the secondary y-axis. It can be seen that the raw valuations of private companies are highly correlated with public equities (correlation of at least 0.76), and more volatile than listed stocks, a similar pattern exhibited by the predicted valuations (correlation of 0.79). Also, finally the correlation between the raw valuations from transactions and our model-predicted valuations is 0.98 indicating that our model does not introduce any bias other than the trends in the raw data.
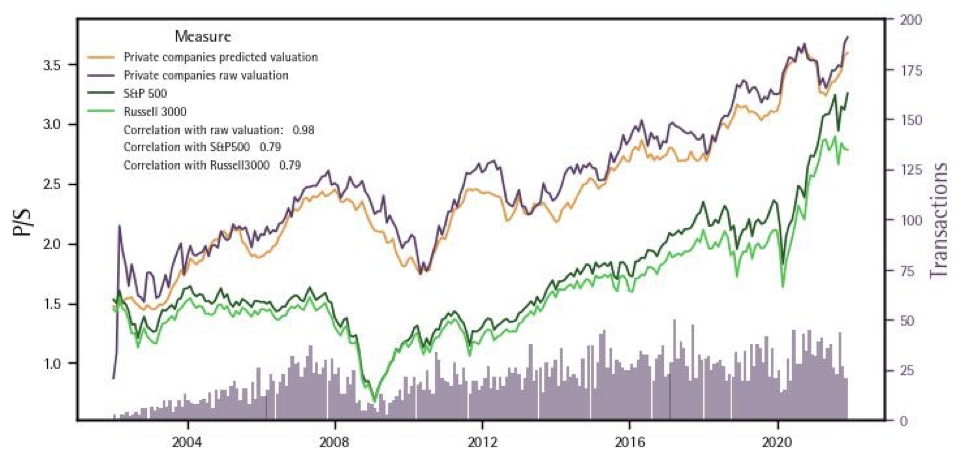
Trends in Predicted vs. Actual Private Market Valuations
Importance of Market Controls
Our model has controls from the public markets, such as the market and sector valuation of publicly listed peers, and hence it is natural to dismiss the models as producing a repackaged public markets index. To put this question to the test, we re-execute our modelling exercise by excluding all market-related control variables, and solely focusing on the company characteristics and PECCS™ indicators as factors and controls, respectively. From the predicted valuations from such a model, we compare how that time series performs relative to the time series from our baseline model. The figure below presents the results. It is clear from the graph that the predicted valuations based on this alternate factor model are exactly similar to those that include market-related controls. Moreover, both the series, i.e., the predicted valuations based on a model excluding market controls and the predicted valuations based on a model including market controls are correlated with a correlation coefficient of 0.999, thus mitigating the concern that market-based controls play a predominant role in the model.
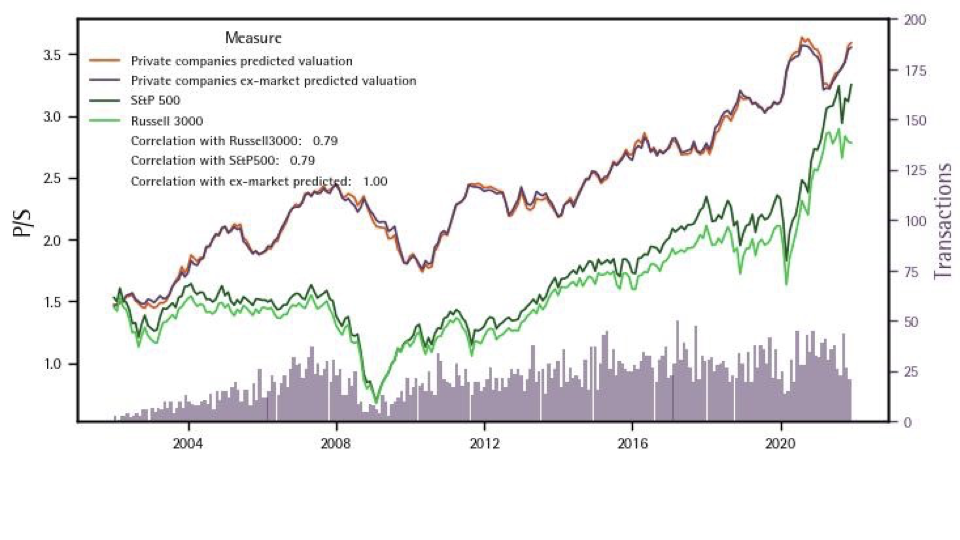
Based on a Model that Excludes All Public Market Based Controls