
How precise and robust are infraMetrics® valuations?
Answer
The produced valuations are in line with observed secondary market prices within a 5% margin of error. The below table shows a distribution of estimation errors when testing our model against 250+ deals.

The residual part of the modelled prices is equivalent to (Gaussian) white noise, confirming that all the systematic effects driving market prices and their variance are well explained by our multi-factor model of risk premia and that only idiosyncratic asset-level ‘noise’ is left unexplained by the model. A model cannot guess exact deal prices, but given the importance of systematic risk factors in the pricing, it can predict the average price given the investment characteristics.
Across 650+ equity investments and 2,700+ debt instruments priced valued over time, the price and total returns produced are not serially correlated i.e., there is no staleness in the asset returns and the variance (volatility) of valuations is not smoothed but instead realistic.
Things to Consider
As a proof of concept, we recently tested our model on over 250+ deals. The below table shows a comparison between mean and median valuation ratios estimated by our model, and the reported mean and median valuation ratios.
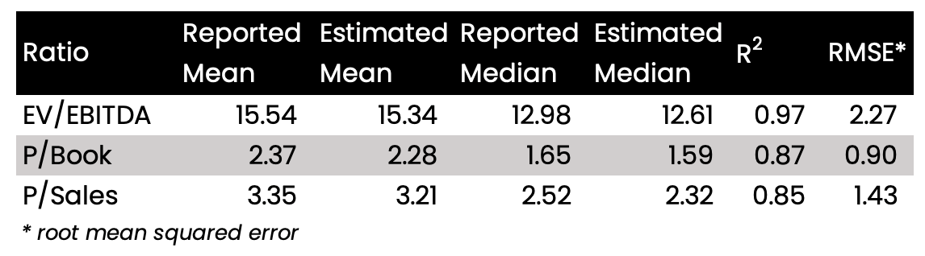
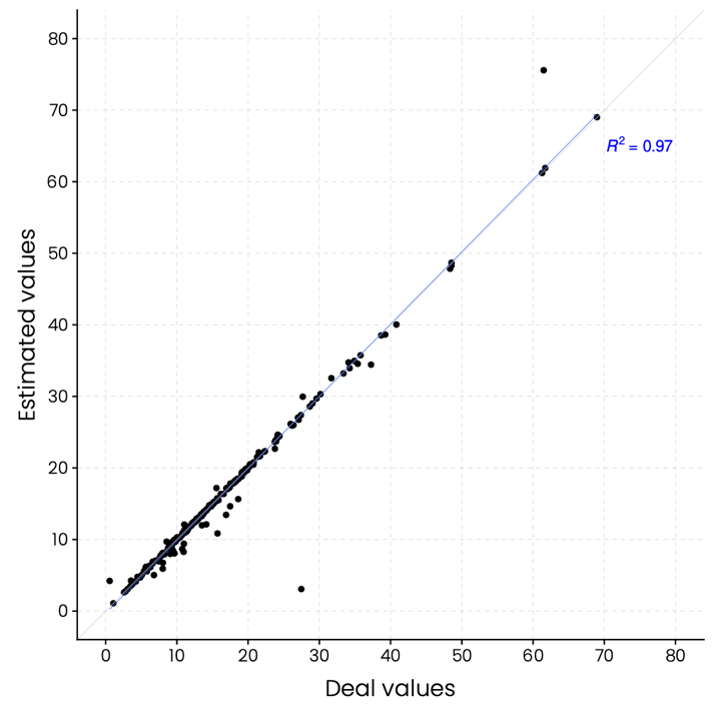
Looking at EV/EBITDA in particular, you can see how close our estimations are to reported deal values, with an R2 value of 0.97.
For further information, you can read our research paper on measuring Fair Value for Unlisted Infrastructure Equity here, which details several valuation case studies.