
Scope 1, 2, and 3 emissions
Climate impact and transition risk assessment are only possible with reliable carbon emission estimates. The GHG protocol (2004) classifies carbon emissions according to different “scopes” (see Figure 2 for an overview of all emission types):
Scope 1 emissions are direct emissions from sources owned or controlled by a company,
Scope 2 emissions are indirect emissions from the generation of purchased electricity,
Scope 3 emissions refer to all other indirect emissions in a company’s value chain, such as emissions from suppliers or customers. According to the GHG protocol (2011), Scope 3 emissions can be differentiated into upstream and downstream emissions: Upstream activities relate to purchased goods and services, leased assets, and employees commuting, among others, while downstream activities include, for example, transportation and distribution of products, end-of-life treatment of products, and investments.
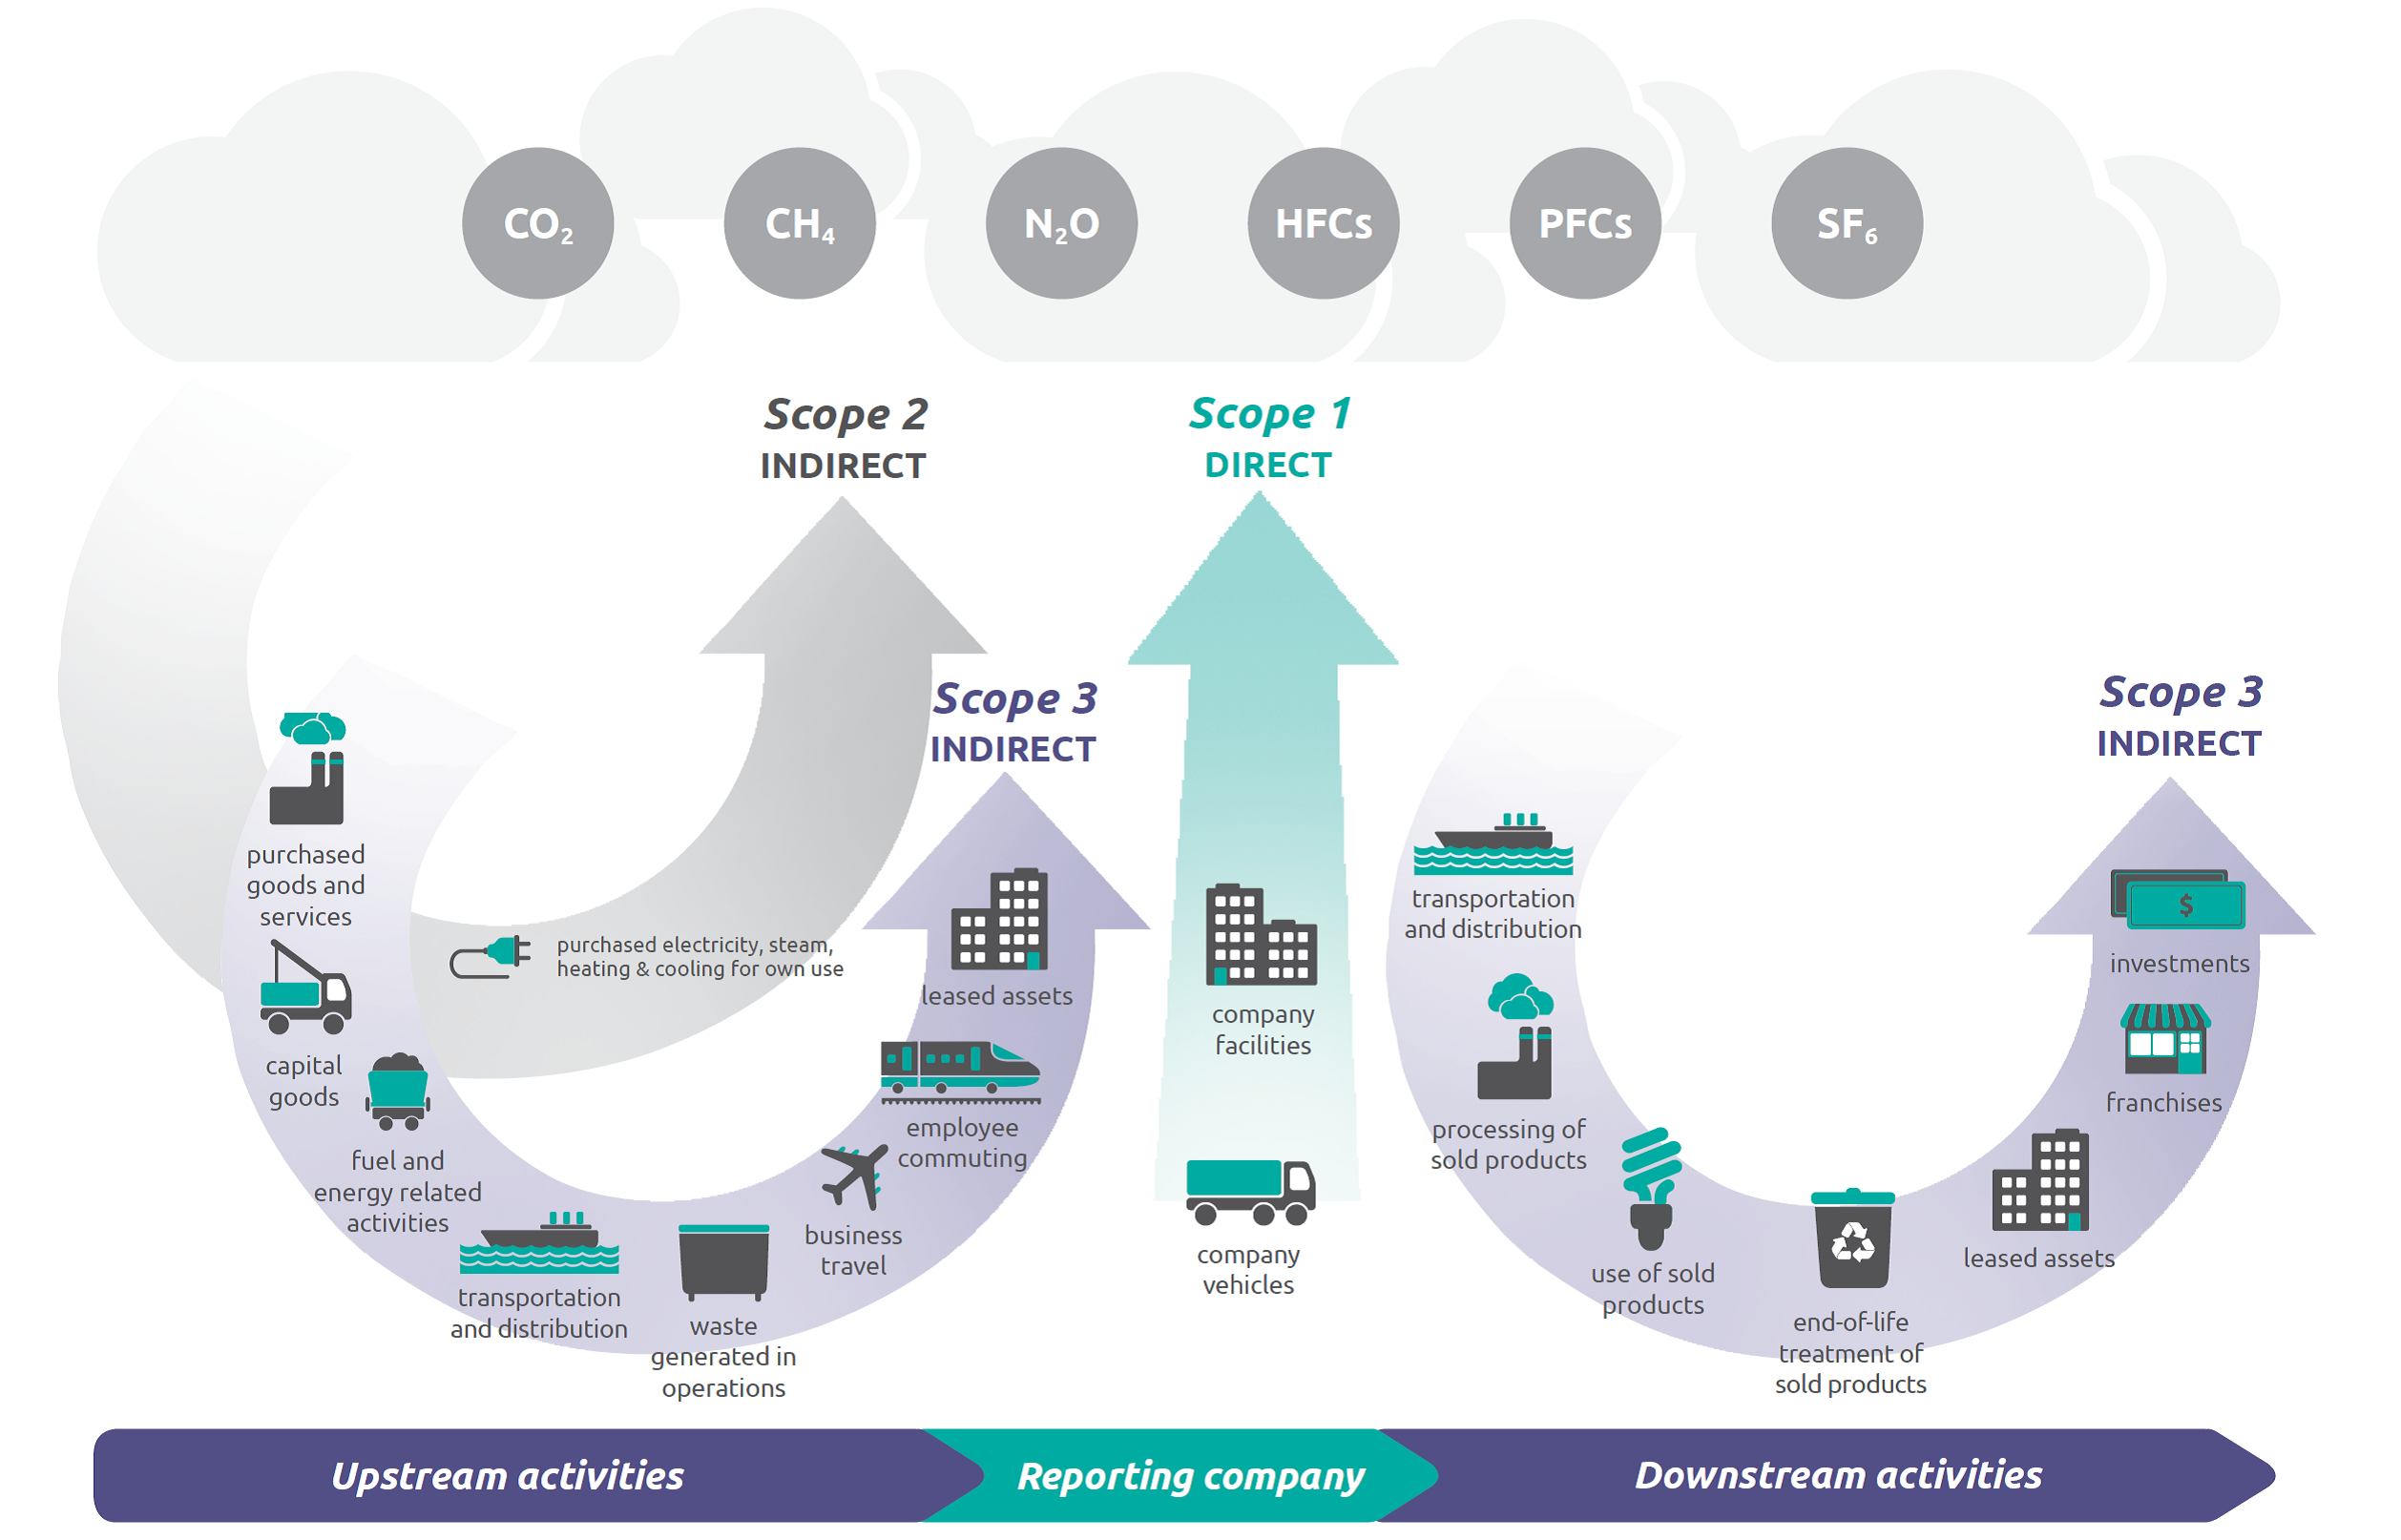
Scope 1, 2, and 3 emissions across the value chain (GHG Protocol, 2011)
In recent years, companies and third-party organisations have made significant progress in measuring two sources of emissions: Directly owned emissions by companies (Scope 1) and the emissions embodied in the energy companies buy (Scope 2). However, measuring and disclosing Scope 3 emissions involves several challenges, including data availability, lack of methodologies, and attribution assumptions. These challenges limit the availability and quality of Scope 3 information (Kutlukaya et al., 2023). For this reason, many estimates of carbon emissions only consider Scope 1 and 2 as proxies of a carbon footprint. Where Scope 3 information is available, we combine all sources of upstream and downstream emissions.
Besides carbon emissions – mainly measured in tons of CO2 and also referred to as carbon footprint to assess a sector’s or asset’s climate impact – carbon intensity provides a transition risk assessment that includes additional metrics, like the asset size or financial key values, to add a ratio to the amount of carbon emissions. This gives asset owners and investors an understanding of the total carbon emissions per revenue, total assets, or equity price, among others. Accordingly, carbon intensity measures a sector’s or asset’s carbon efficiency and can be used to compare emissions of different sectors, countries, or assets within the same industry (Earthshift Global, 2023).
Earthshift Global (2023, May 1). Carbon footprint vs. carbon intensity. Earthshift Global. https://www.earthshiftglobal.com/blog/carbon-footprint-vs.-carbon-intensity
GHG Protocol (2004). A corporate accounting and reporting standard. https://ghgprotocol.org/sites/default/files/standards/ghg-protocol-revised.pdf
GHG Protocol (2011). Corporate value chain (Scope 3) accounting and reporting standard.https://ghgprotocol.org/sites/default/files/standards/Corporate-Value-Chain-Accounting-Reporing-Standard_041613_2.pdf
Kutlukaya, M., Fornino, M., Shirono, K., Prasad, A., & Seneviratne, D. (2023). Carbon footprint of bank loans – A measure of transition risks for the financial sector. In S. Arslanalp, K. Kostial. & G. Quiros-Romero (Eds.), Data for a Greener World: A Guide for Practitioners and Policymakers (pp. 113-139). Washington, DC: International Monetary Fund.