1.2.2 PRIVATEMETRICS.INFRA_EQUITY_COMPARABLE
INFRA_EQUITY_COMPARABLE (METRIC, CURRENCY, AGEINMONTHS, ENDDATE, WINDOWINYEARS, INDUSTRIALACTIVITIES, BUSINESSRISK, CORPORATESTRUCTURE, COUNTRIES, SIZE, LEVERAGE, PROFITABILITY, INVESTMENT, TIMETOMATURITY, TYPE)
Perform a comparable computation for private infra equity. This involves finding datapoints which have similar TICCS classifications and factor values (the comparables dataset) and averaging the metric values
Parameters
METRIC: Text
The Metric for which the comparable has to be evaluated. (“ev2ebitda”, “irr”, “p2b”, “p2sales”, “premia”, “wacc”, “revenue_growth”)
CURRENCY: Text
The currency of monetary factor inputs such as SIZE ('USD', ‘EUR’, ‘GBP’)
AGEINMONTHS: Number
The age of the company in months. The comparable computation will keep companies within 6 months of this value. If set, ENDDATE and WINDOWINYEARS will be ignored
ENDDATE: Date
The max date of the comparable dataset
WINDOWINYEARS: Number
The window in years of the comparable dataset. In other words, the min date of the comparable dataset = ENDDATE - WINDOWINYEARS
INDUSTRIALACTIVITIES: Range(Text), Text
Comma-separated or cell range selection of industrial activity TICCS code. See here for definitions. (“IC10”, “IC20”, “IC30”, “IC40”, “IC50”, “IC60”, “IC70”, “I80”, “IC6010”, etc.. Different industrial activity levels can be combined.)
BUSINESSRISK: Text
Business risk TICCS code. See here for definitions. (“BR1”, “BR2”, “BR3”)
CORPORATESTRUCTURE: Text
Corporate structure TICCS code. See here for definitions. (“CS1”, “CS2”)
COUNTRIES: Range(Text), Text
Range of countries as three-letter ISO code. The possible values can be obtained by calling PRIVATEMETRICS.COUNTRIES()
SIZE: Number (Million)/ Text
Total assets. Absolute value (in CURRENCY) or quintile (“Q1”, “Q2”, “Q3”, “Q4”, “Q5”)
LEVERAGE: Number (Percentage)/ Text
Total senior liabilities over total assets. Percentage value or quintile (“Q1”, “Q2”, “Q3”, “Q4”, “Q5”)
PROFITABILITY: Number (Percentage)/ Text
Return on assets. Percentage value or quintile (“Q1”, “Q2”, “Q3”, “Q4”, “Q5”)
INVESTMENT: Number (Percentage)/ Text
CAPEX over total assets. Percentage value or quintile (“Q1”, “Q2”, “Q3”, “Q4”, “Q5”)
TIMETOMATURITY: Number/ Text
Years until maturity. Years or bucket (“T1”, “T2”, “T3”, “T4”, “T5”). The buckets cover the following ranges:
T1: 0-5 years, T2: 5-10 years, T3: 10-15 years, T4: 15-20 years, T5: 20+ years
TYPE: Text
To determine how to aggregate the comparables dataset. The default is “mean”. (“mean”, “median”, “obs_count”, “company_count”, “p25”, “p75”, “min” and “max”)
p25 and p75 are the 25th and 75th percentile respectively
Returns
number
Examples
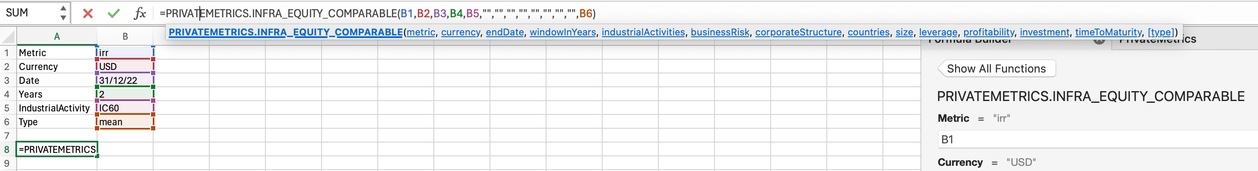
=PRIVATEMETRICS.INFRA_EQUITY_COMPARABLE("irr", "USD", , DATE(2022,12,31), 2, "IC60","","","","","","","","","mean")Returns
9.3%
This can also be called by referencing values from the spreadsheet