
b) carbon tax and emissions
One measure commonly undertaken to mitigate carbon emissions is to increase their costs through a carbon tax, which affects the price of carbon emissions (Richters et al., 2022). An increase in carbon tax is thus expected to induce a decrease in carbon emissions. The figure below shows the projections of a carbon tax in the United States until 2050 for all NGFS and Oxford Economics scenarios.
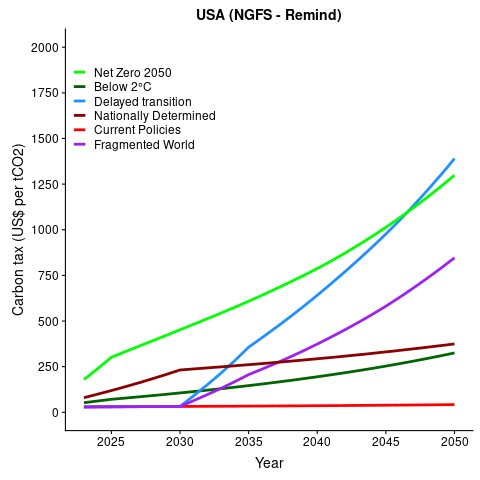
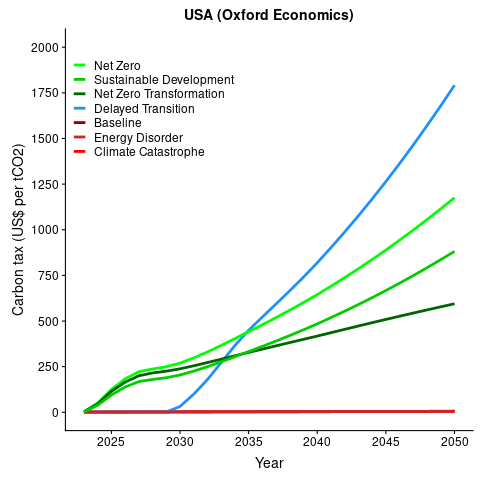
Carbon tax projections in the United States for all NGFS (left) and Oxford Economics (right) scenarios.
Again, Oxford Economics differentiates clearly between orderly, disorderly, and no transition scenarios: immediate and medium carbon taxes (between USD 500 and USD 1000 per tCO2 by 2050) for the orderly transition scenarios (green), a delayed and high carbon tax (around USD 1,750 per tCO2 by 2050) for the disorderly scenario, and no carbon tax for the no transition scenarios. The same applies to NGFS’ Net Zero 2050 (orderly) and Current Policies (no transition) scenarios. However, NGFS scenarios differentiate less clearly between the orderly Net Zero 2050 and the disorderly Delayed Transition scenarios. Additionally, the carbon taxes for the NDC and Below 2°C scenarios do not follow their narratives (e.g., the no transition scenario projects a higher carbon tax than the orderly scenario), and their projections are not distinct enough to represent no transition and orderly scenarios, respectively.
The figure below shows the projections of CO2 emissions in the United States for all NGFS and Oxford Economics scenarios. In all NGFS scenarios, emissions decrease but at a different pace: The Net Zero 2050 scenario (light green) reflects the fastest decrease in carbon emissions, while the decrease is the slowest in the Current Policies scenario (light red). In line with the introduction of a carbon tax in 2030, emissions in the Delayed Transition scenario remain similar to the ones in the Current Policies scenario. After 2035, carbon emissions drop rapidly to a level similar to the emissions in the Net Zero 2050 scenario. Overall, the NGFS projections are very optimistic considering i) decreasing emissions across all (also no transition) scenarios and ii) future negative emissions across most scenarios (the only exception is the Current Policies scenario).
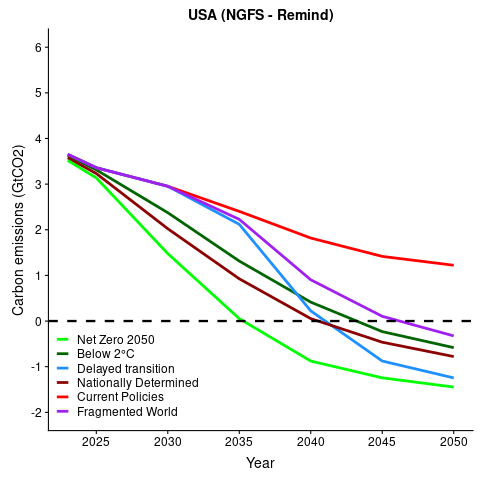
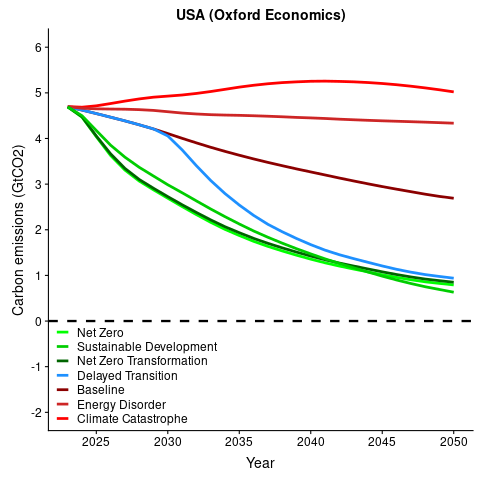
Projections of CO2 emissions in the United States for all NGFS (left) and Oxford Economics (right) scenarios.
In comparison, the carbon emission projections look more realistic in the Oxford Economics scenarios where – again – we can observe a clear distinction between the transition types (orderly, disorderly, no): According to the Climate Catastrophe scenario, carbon emissions increase slightly until 2040 and remain stable after that. This seems to correctly reflect a world in which no efforts are made to fight climate change. The orderly and disorderly (after 2030) scenarios project the highest decrease in carbon emissions, while the Baseline scenario offers a middle way. Here, carbon emissions decrease slowly, in line with the expected implementations of climate policies on a national level. However, carbon emissions in all scenarios remain above zero.
Richters, O., Bertram, C., Kriegler, E., Anz, J., Beck, T., Bresch, D., … Zwerling, M. (2022). NGFS climate scenario database. Technical documentation V3.1. https://www.ngfs.net/sites/default/files/media/2022/11/21/technical_documentation_ngfs_scenarios_phase_3.pdf