
a) GDP and inflation
The figure below shows the projections of GDP in all scenarios of NGFS (left) and Oxford Economics (right)[1]. Oxford Economics’ GDP projections are different across scenarios. In particular, the Climate Catastrophe scenario (light red) dramatically affects the GDP, with a negative development after 2040. In comparison, GDP grows slowly in the Baseline scenario (dark red) and faster in the three orderly scenarios (green). Furthermore, Oxford Economics projects a clear impact of carbon taxes on GDP growth in 2030 for the Delayed Transition scenario. By contrast, GDP grows relatively fast in the NGFS scenarios, with no significant differences across scenarios.
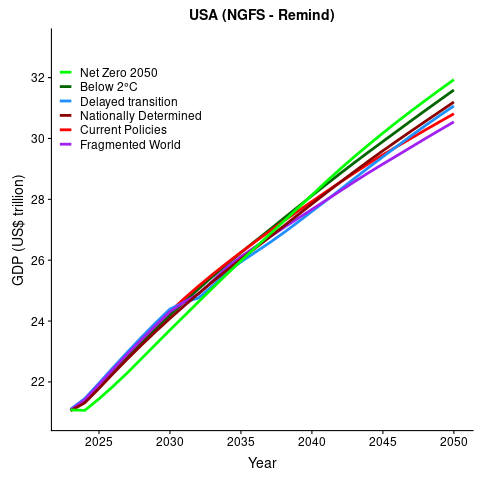
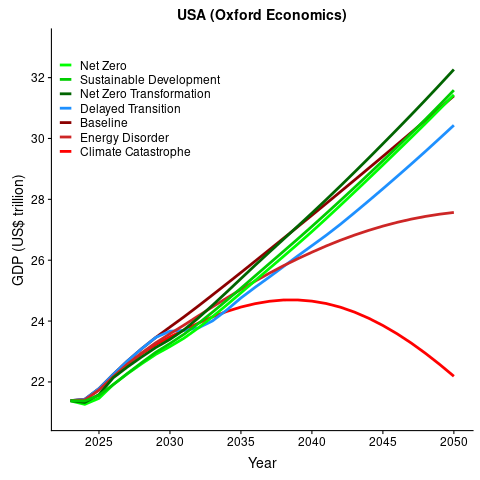
GDP projections in the United States for all NGFS (left) and Oxford Economics (right) scenarios.
The figure below shows the projections of inflation in all scenarios of NGFS (left) and Oxford Economics (right) in the United States. NGFS projects high inflation (about 6.5%) in the Net Zero scenario, which then drops significantly until 2040 when it regulates itself below 2.5 per cent in 2050. In all other scenarios, inflation follows a similar path of robust two to three per cent between 2025 and 2050. The only exception is a short bump in the Delayed Transition scenario reflecting the introduction of a carbon tax after 2030. In comparison, Oxford Economics differentiates slightly more across scenarios: In the Climate Catastrophe scenario, inflation constantly increases between 2025 and 2050. Combined with the decrease in GDP, this scenario depicts a catastrophic future for the United States’ macroeconomy. Similar to NGFS, the other scenarios show a stable inflation range between two and three per cent, with a similar bump in the Delayed Transition scenario between 2030 and 2035.
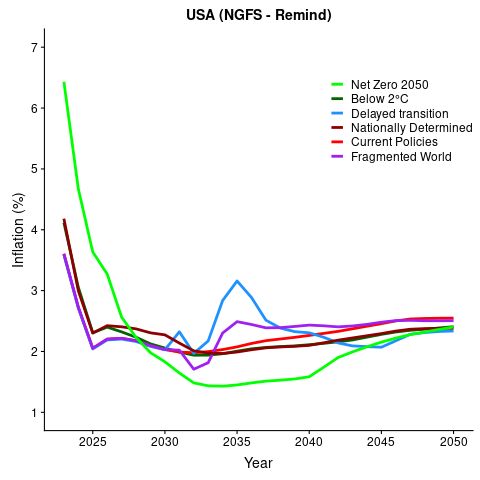
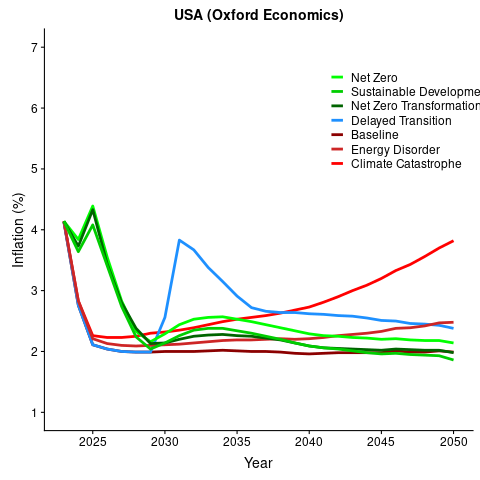
Inflation projections in the United States for all NGFS (left) and Oxford Economics (right) scenarios.
[1] Note that we match colours for equivalent scenarios across NGFS and Oxford Economics. However, not all scenarios are fully equivalent and different assumptions underlie them.