
2.4.4 Robustness of the climate risk models
Robustness of the Regression Models
The table below presents the results of the regression analyses performed for both corporate and project companies. The regression coefficients are all highly significant. The R2 for both company types are relatively small (as expected when dealing with growth rates). Residuals are distributed close to normal, around 0, with very low autocorrelation levels. The results demonstrate a high level of robustness of our models.
Table: Regression results for corporate and project companies | ||||
| Corporate companies | Project companies | ||
Regressor | Total assets | Revenues | Total assets | Revenues |
Total assets L1 | 0.078*** (0.016) |
| 0.043*** (0.013) |
|
GDP L1 | 0.344*** (0.076) |
| 0.163*** (0.046) |
|
Inflation L1 | 1.274*** (0.157) |
| 0.631*** (0.087) |
|
Percent Lifetime |
|
| -0.038*** (0.003) |
|
Total asset |
| 0.236*** (0.024) |
| 0.243*** (0.018) |
Constant | -0.006*** (0.002) |
| -0.006*** (0.002) |
|
Observations | 3,486 | 1,107 | 5,195 | 1,871 |
Adjusted R2 | 0.032 | 0.077 | 0.042 | 0.085 |
Note: L1 denotes the first lag (i.e., value in the previous year) of a variable. *p < .1; **p < .05; ***p < .01 | ||||
Robustness of the Asset Pricing Model
For the 250+ transactions that correspond to companies tracked in the Scientific Infra & Private Assets' universe and for which observed secondary market prices are also available, we compare observed and model-predicted valuations directly. The figure below shows a comparison between model-predicted internal rate of return (IRR; left panel), risk premia (central panel) and ratios of a company’s enterprise value to its earnings before interest, depreciation, taxes, and amortisation (EV/EBIDTA; right panel) with actual values for a test dataset of 250+ observed transactions that occurred between 2000 and 2020.
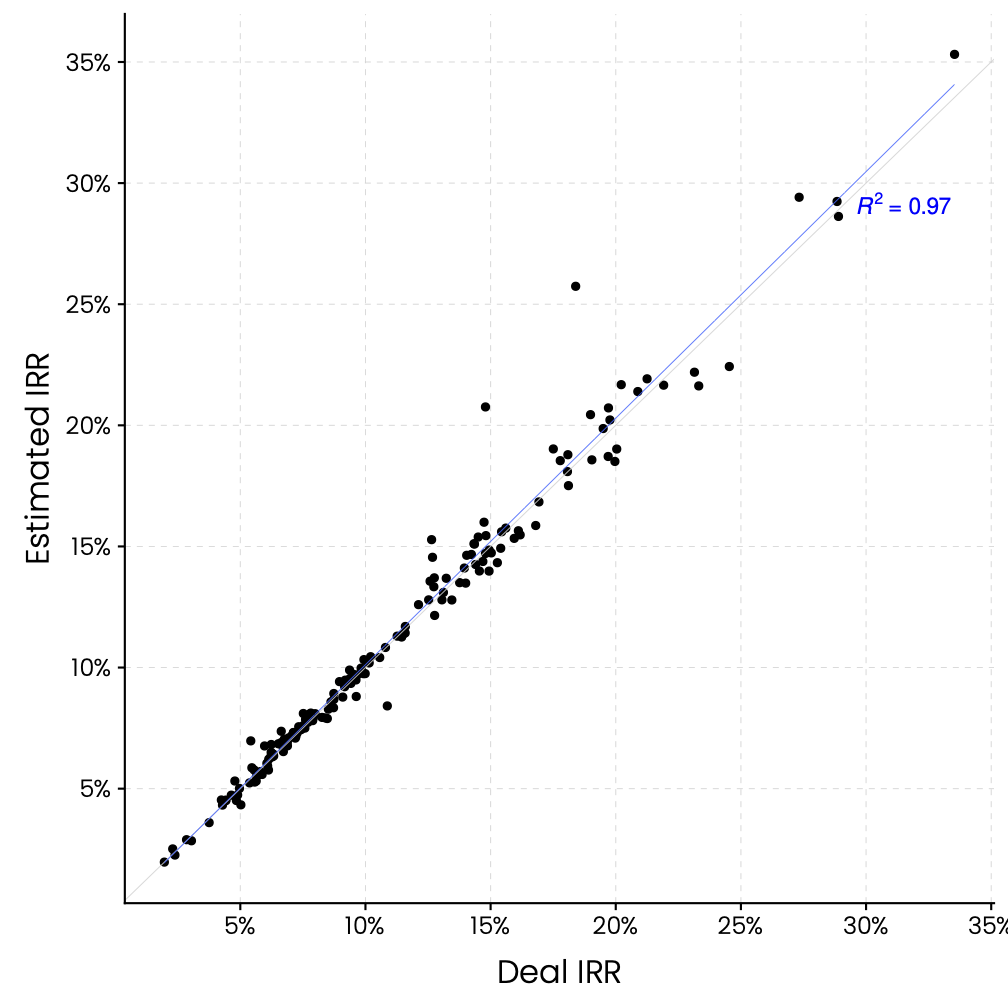

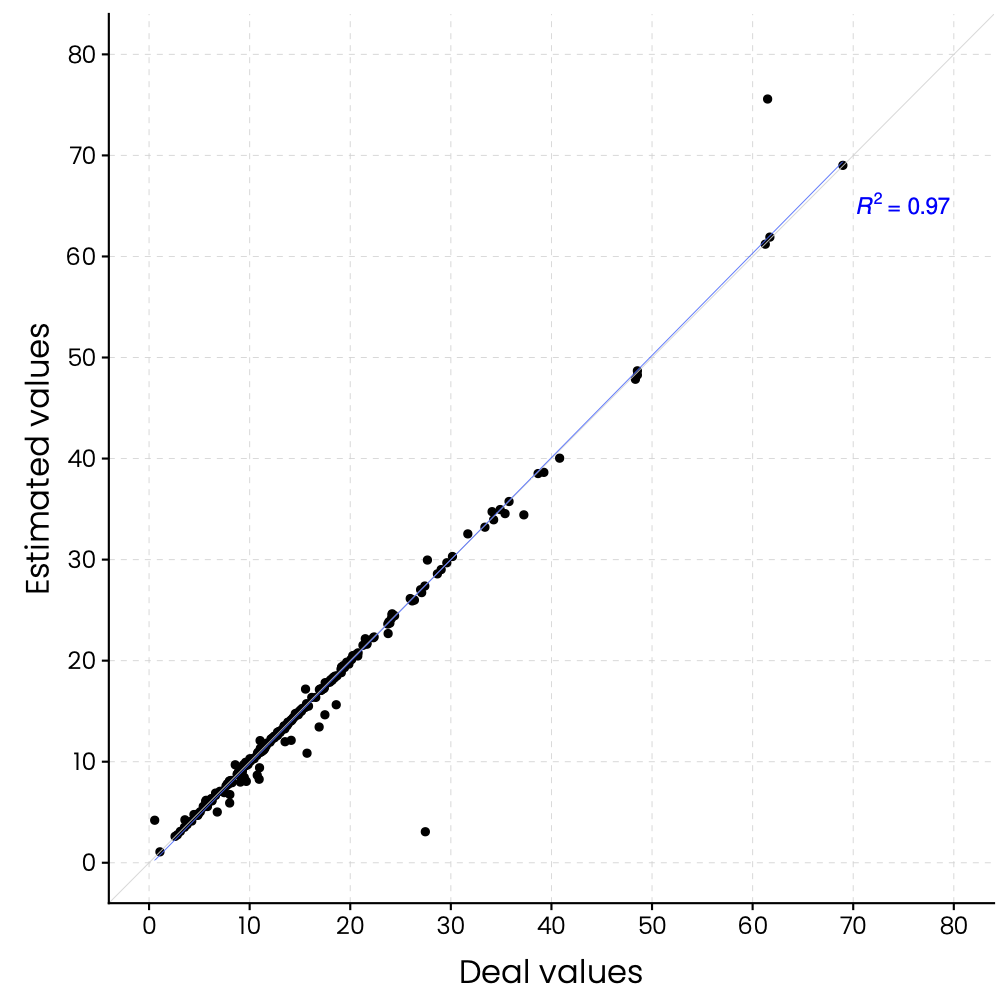
Comparison between model-predicted IRR, risk premia, and EV/EBIDTA ratios with actual values for the test dataset of 250+ observed transactions between 2000 and 2020.
The closeness of the dots around the 45-degree lines and the high values of R2 support the accuracy of the model-predicted prices. The prediction error is typically within 5% of the observed prices (see tables below).
Table: Quantiles of model errors | |||||
10% Quantile | 25% Quantile | Median | Mean | 75% Quantile | 90% Quantile |
-5% | -1.95% | -0.22% | -0.55% | 1.64% | 3.85% |
Table: Estimated vs reported valuation ratios and model’s goodness-of-fit | ||||||
Ratio | Reported mean | Estimated mean | Reported median | Estimated median | R2 | RMSE |
EV/EBITDA | 15.54 | 15.34 | 12.98 | 12.61 | 0.97 | 2.27 |
P/Book | 2.37 | 2.28 | 1.65 | 1.59 | 0.87 | 0.9 |
P/Sales | 3.35 | 3.21 | 2.52 | 2.32 | 0.85 | 1.43 |
Note: RMSE = root mean square error | ||||||