
2.3.3 Analysis of default rates and average probabilities of default (PD)
The average probabilities of default (PD) closely align with the default rates in many years, demonstrating the effectiveness of the PD in predicting defaults. The average PD remains consistent at around 2% for most years. This suggests that the model and approach used to calculate PD are stable and have a low level of variability. The default rates and average PD match closely in most years, indicating that the PD can accurately capture the risk of default for each year.
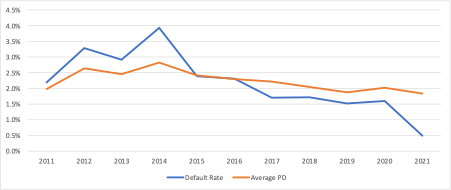
Average probabilities of default (PD) time series