1.4.1 Benchmarks task pane
There are multiple ways to interact with our product, which is tailored to all levels of Microsoft Excel users. One is via the task pane. For the task pane, we have controls and searchable inputs that give you suggestions as you type.
To start with, our task pane can be opened via the Ribbon Toolbar under the privateMetrics tab.
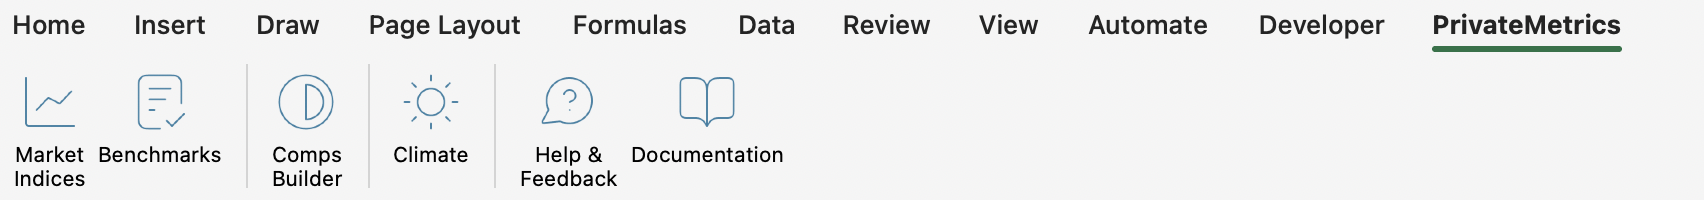
From there, we can click Benchmarks to open the task pane.
Benchmark overview
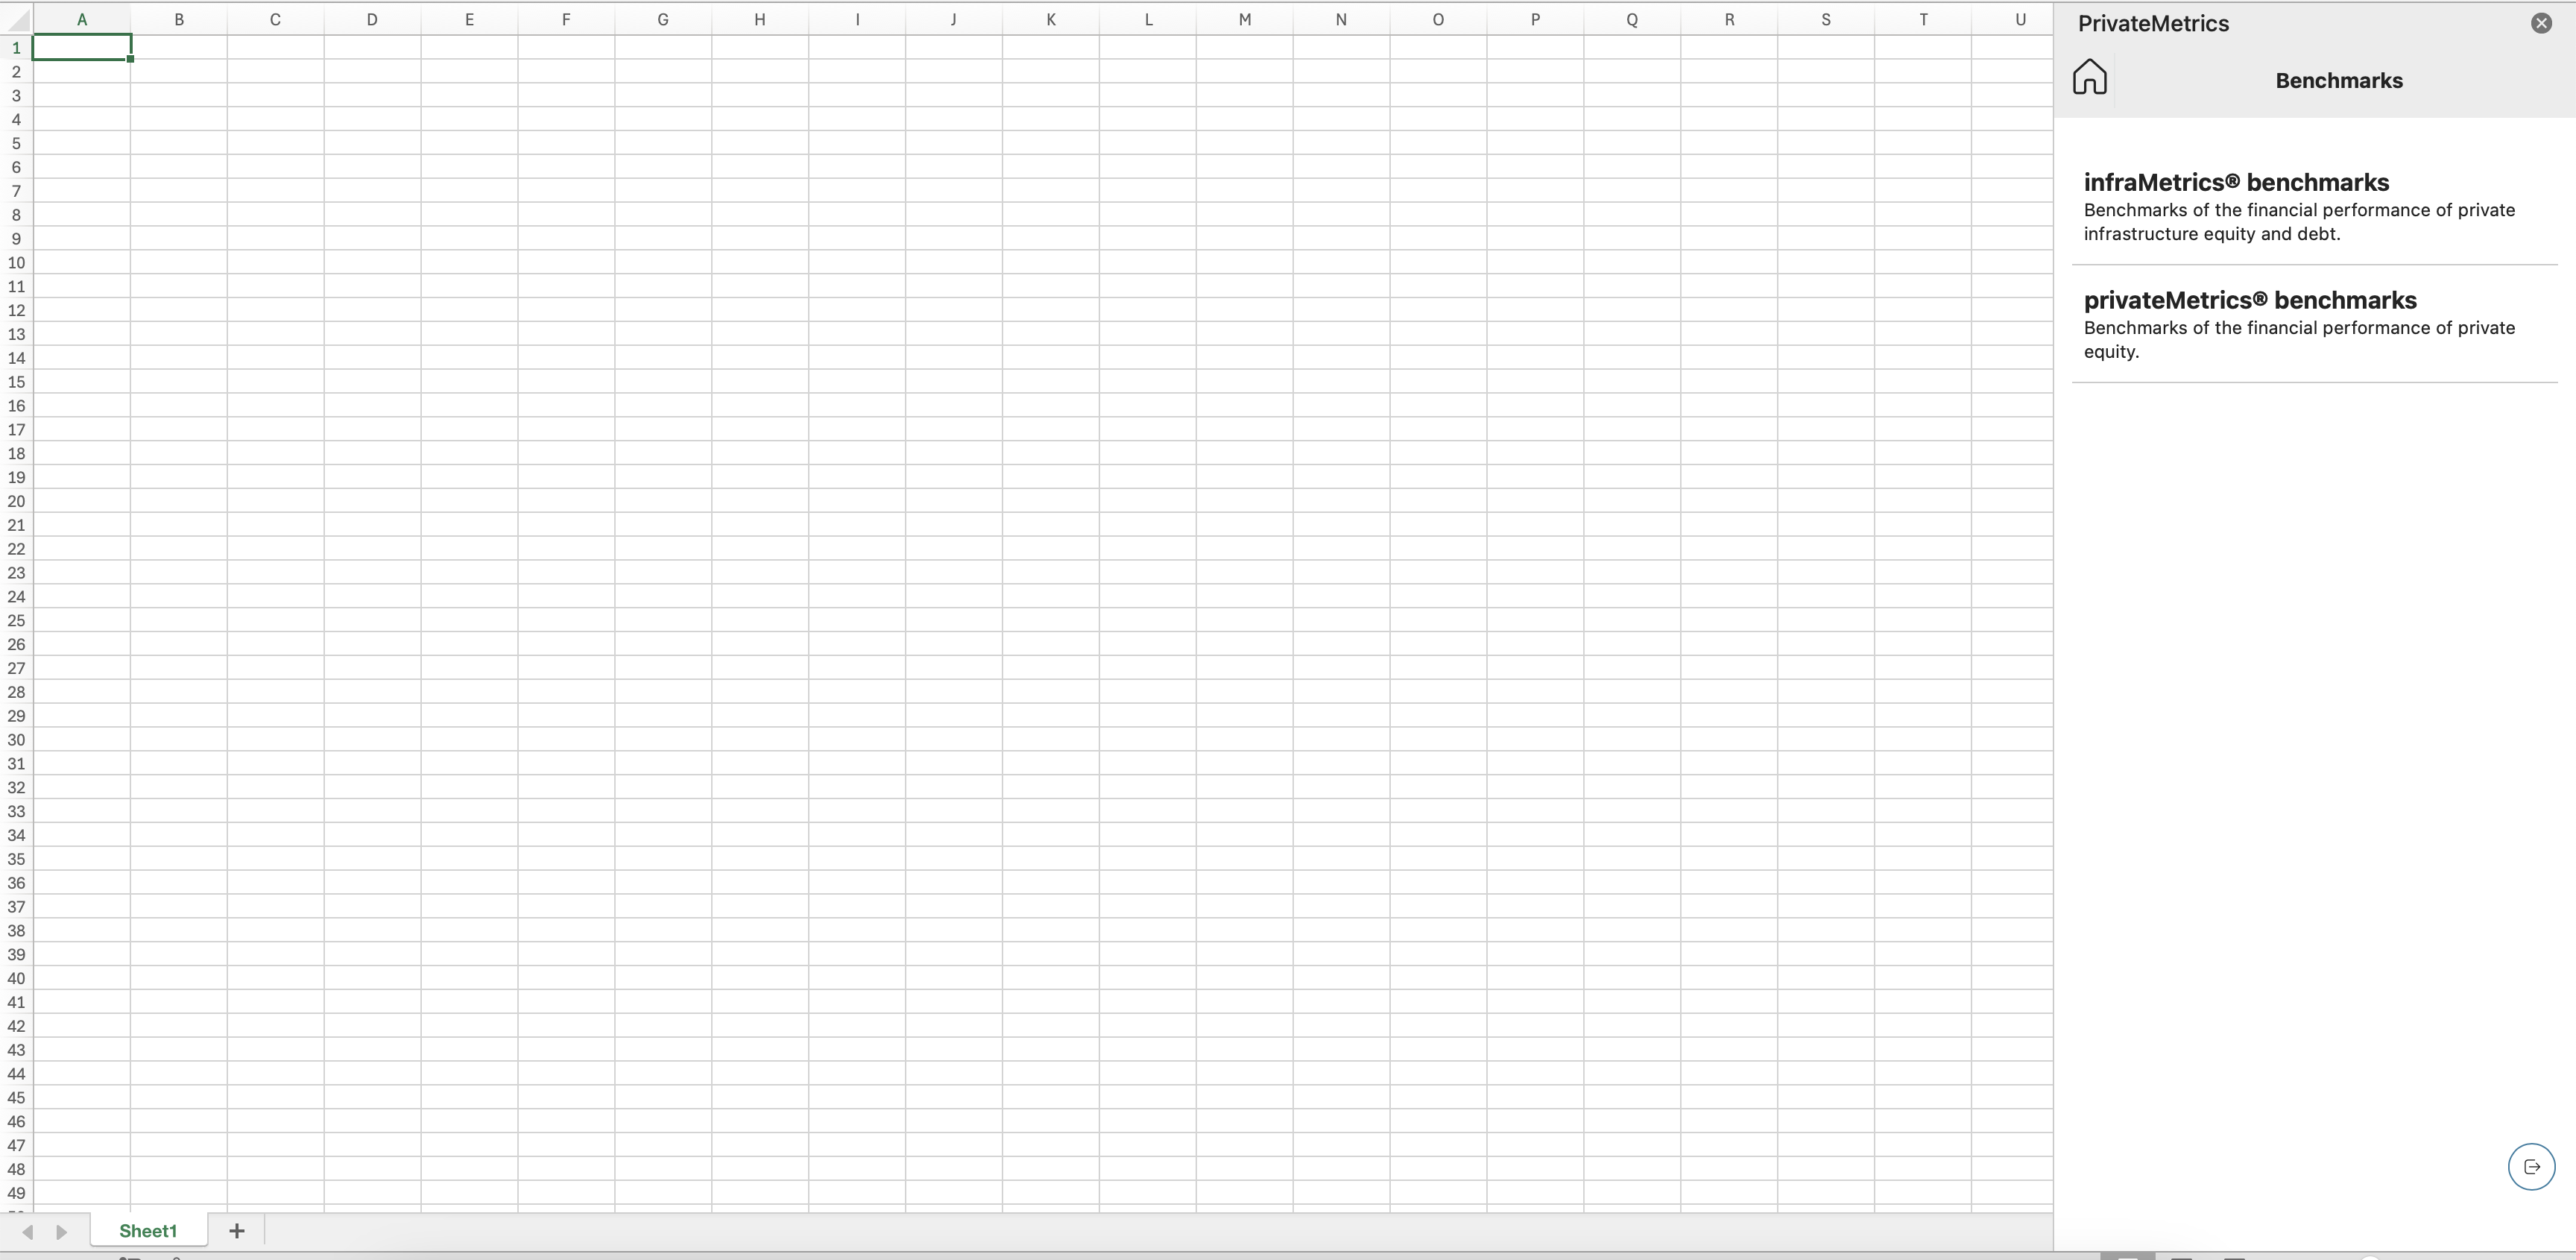
This will open the task pane on the right-hand side of the window. From there, we can select either infraMetrics® benchmarks or privateMetrics® benchmarks.
infraMetrics® benchmarks - Benchmarks of the financial performance of private infrastructure equity and debt markets.
privateMetrics® benchmarks - Benchmarks of the financial performance of the private equity markets.
The Query Builder
Our Query Builder is designed to be simple yet intuitive to use. In this section, we will explain the elements of this user interface.
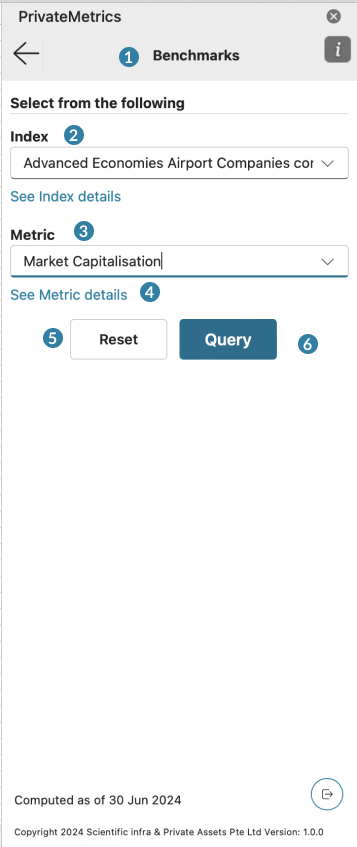
Title Bar - It will show the current App or Product we are in and a Go Back button to return to the previous menu.
Index Selector - This will list all the indices that belong to either infraMetrics® or privateMetrics®.
Depending on the user’s permission, some might be locked and disabled (see picture).

Example: A blocked index
Metric Search - Users can search/filter via keywords for the metrics they want. We have shown a small description to give users an idea about the metric.
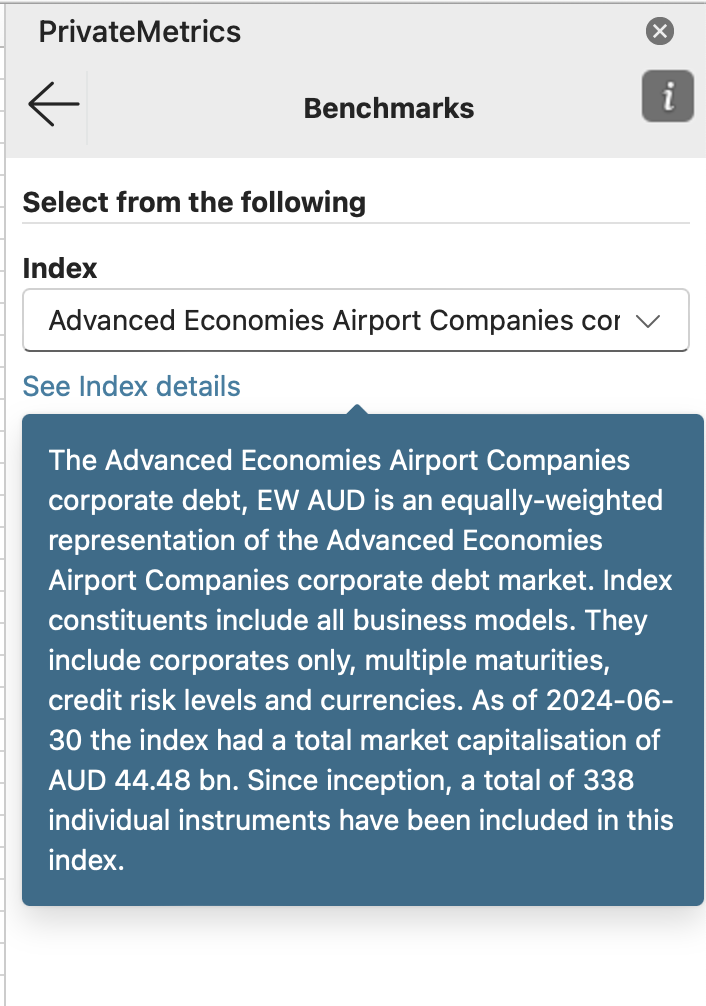
Helpers (see metric/index details) - Once hovered, this will show the description of the selected index/metric.
Reset Button - This button resets all the input.
Query Button - This button creates a query based on the input above. The results will be displayed in the active cell selected on the sheet.
Once everything is ready, we can hit the Query button and see the results on our sheet.
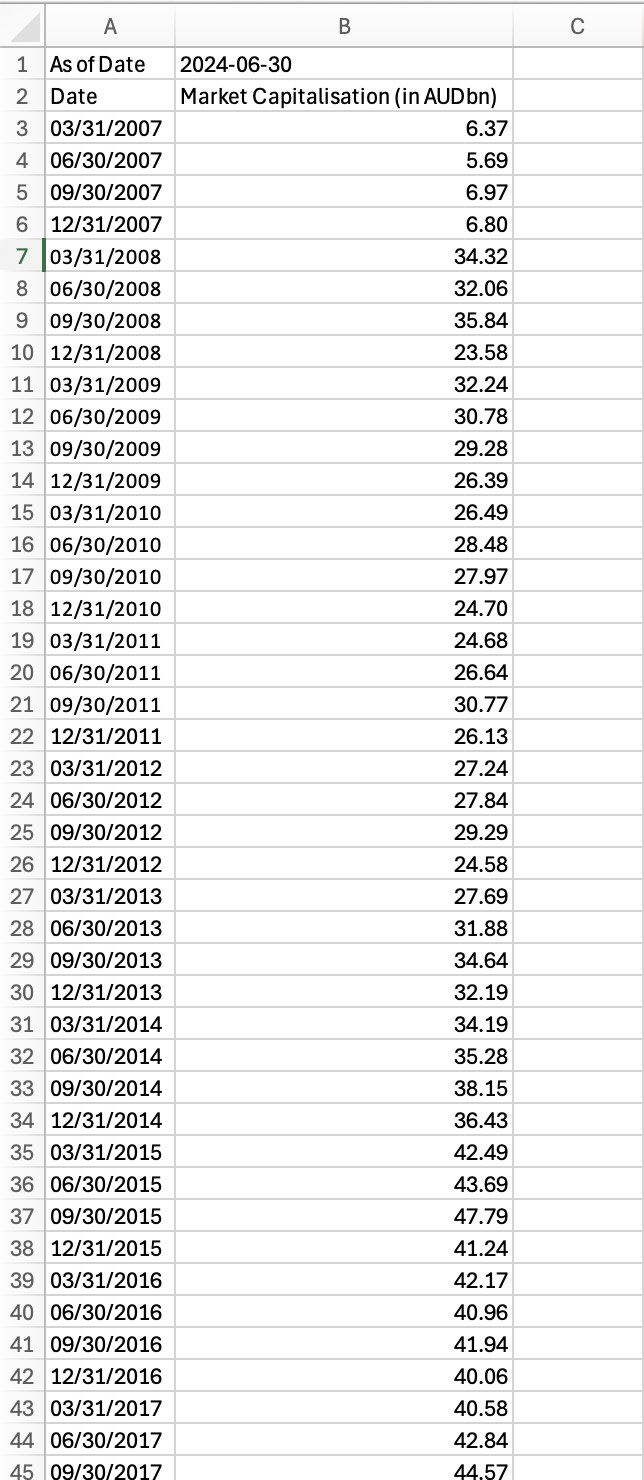
Query results
The active sheet will show the data, and a formula is wrapped for its range. It will also show other metadata like the date it was reported and the value date. In the future, the sheet will present additional metadata, like tickers and index names. This is currently under development.